Houston Area Calculus Teachers
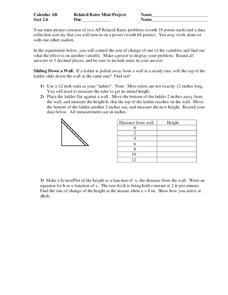
Related Rates
Use a hands-on approach to exploring the concepts of related rates in your AP Calculus class. Individuals explore the effect of the rate of change on a variable related to a variable they control. After analyzing the data they collect,...
Curated OER
Cardiac Output, Rates of Change, and Accumulation
Students explore rates of change. In this cardiac output lesson, students measure the amount of blood being pumped by a heart. They explore the flow rate and complete an accumulation and concentration problem. They analyze data, flow...
Curated OER
Working with Rates of Change
In this calculus worksheet, students problem solve 8 word problems involving rates of change in association with high school students. Students work out each problem and give a short explanation of each answer.
Balanced Assessment
Ford and Ferrari
Which is faster, a Ford or a Ferrari? The short assessment has pupils analyze graphs to determine the rates of change between the two. Individuals interpret the rates of change within the context of speeds of the cars and develop a map...
Curated OER
Mathemafish Population
It's shark week! In this problem, young mathematically minded marine biologists need to study the fish population by analyzing data over time. The emphasis is on understanding the average rate of change of the population and drawing...
Mathematics Vision Project
Quadratic Functions
Inquiry-based learning and investigations form the basis of a deep understanding of quadratic functions in a very thorough unit plan. Learners develop recursive and closed methods for representing real-life situations, then apply these...
Kenan Fellows
Man vs. Beast: Approximating Derivatives using Human and Animal Movement
What does dropping a ball look like as a graph? An engaging activity asks learners to record a video of dropping a ball and uploading the video to software for analysis. They compare the position of the ball to time and calculate the...
Utah Education Network (UEN)
Linear Graphs Using Proportions and Rates
Using a TI-73 or other similar graphing calculator middle school math majors investigate the linear relationship of equivalent proportions. After a brief introduction by the teacher, class members participate in a timed pair share...
Consortium for Ocean Science Exploration and Engagement (COSEE)
Ocean Acidification: Whats and Hows
Open this lesson by demonstrating the production of acidic carbon dioxide gas by activated yeast. Emerging ecologists then experiment with seashells to discover the effect of ocean acidification on shelled marine organisms. They measure...
PBL Pathways
College Costs
Predict the year that college costs will double in your state using linear modeling. The first part of this two-part project based learning activity asks young mathematicians to use data from the College Board. They graph the data, write...
Ms. Amber Nakamura's Mathematics Website
Algebra Project
What would your dream house look like? A cottage? A medieval castle? High schoolers enrolled in Algebra design the perfect house while using slopes to write equations for various aspects of the project.
Curated OER
Even More Calculus
In this calculus worksheet, 12th graders differentiate and integrate basic trigonometric functions, calculate rates of change, and integrate by substitution and by parts. The twenty-two page worksheet contains explanation of the topic,...
Curated OER
Environmental Agents of Mathematics: Mathematics for Change
High schoolers analyze environmental science data using Math. They do research about renewable energy, gather data, create graphs and interpret their findings. Then the group presents their arguments persuasively using their findings to...
Utah Education Network (UEN)
Linear Relationships: Tables, Equations, and Graphs
Pupils explore the concept of linear relationships. They discuss real-world examples of independent and dependent relationships. In addition, they use tables, graphs, and equations to represent linear relationships. They also use ordered...
National Wildlife Federation
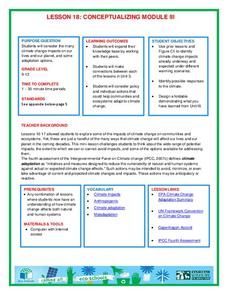
Conceptualizing Module III
Many researchers focus on one impact of climate change in isolation, but researchers gain a global perspective when they come together. A timely lesson teaches scholars about the projected impacts of global temperature increases. Then...
PBL Pathways
College Costs 2
What is the financial benefit for attending a community college for the first two years before transferring to a four-year college? The second part of the educational lesson asks young scholars to explore this question through data...
5280 Math
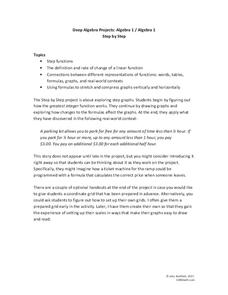
Step by Step
One step at a time! A seemingly linear relationship becomes an entirely new type of function. Young scholars build their understanding of step functions by completing a three-stage activity that incorporates multiple representations of...
Mathematics Common Core Toolbox
Golf Balls in Water
Here's a resource that models rising water levels with a linear function. The task contains three parts about the level of water in a cylinder in relationship to the number of golf balls placed in it. Class members analyze the data and...
Balanced Assessment
Oil Consumption
An assessment presents a chart displaying oil consumption Pupils use the chart to determine the greatest increase in consumption, and then apply that information to figure out when the consumption may reach 100 million barrels a day.
Balanced Assessment
Bathtub Graph
Represent the relationship between independent and dependent variables through a modeling situation. The activity expects learners to graph the volume of water in a bathtub during a given scenario. The graph should result in two areas of...
National Wildlife Federation
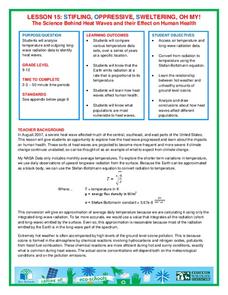
Stifling, Oppressive, Sweltering, Oh My!
Looking for a hot date? Pick any day in August, statistically the hottest month in the United States. The 15th lesson in the series of 21 instructs pupils to investigate the August 2007 heat wave through NASA data, daily temperature...
Curated OER
Humane Science Projects
In this science worksheet, middle schoolers examine the list of possible science projects. They look for the characteristics that set apart these ideas as humane.
Curated OER
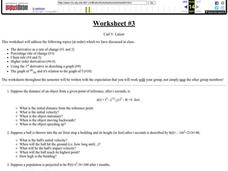
Worksheet #3, Derivative Rates, Percent Rate of Change, Chain Rule
In this calculus worksheet, students answer compute the distance of an object from a given point after t seconds when given the formula. They use the chain rule to answer 2 questions. Students compute the derivatives and sketch a graph...
Bowland
My Music
Scholars investigate how the tempo of music affects heartbeats. Groups develop hypotheses about music and its connection to heartbeats before carrying out an experiment. They analyze and present data from their investigations.


