Curated OER
Introducing y = mx + b
Middle and high schoolers use the slope intercept form to graph a line. In this algebra lesson, pupils rewrite equations from standard form to y-intercept form. They use the slope and y-intercept to graph a line without making a table of...
EngageNY
Constant Rates Revisited
Find the faster rate. The resource tasks the class to compare proportional relationships represented in different ways. Pupils find the slope of the proportional relationships to determine the constant rates. They then analyze the rates...
College Board
Reasoning from Tabular Data
Don't table the resource—use it now. An AP® Calculus curriculum module encourages the use of tabular data throughout the course. It provides some example topics, such as rate of change, net change, and average value of a function, where...
Curated OER
Dragonfly
The speed of a dragonfly brings math into the real world as your learners collaboratively see the value in calculating unit rates in direct proportion problems. This six-phase lesson plan encourages you, as the teacher, to only ask...
Illustrative Mathematics
Cooking with the Whole Cup
Whoops! Travis accidentally put too much butter into the recipe. Your bakers must find out how to alter the recipe to accommodate different changes by using unit rates and ratios . The activity has multiple parts and calculations with...
Inside Mathematics
Conference Tables
Pupils analyze a pattern of conference tables to determine the number of tables needed and the number of people that can be seated for a given size. Individuals develop general formulas for the two growing number patterns and use them to...
Herff Jones Education
Reaction Rates
Equip pupils with tools to determine reaction rates as they explore conditions that cause a reaction to increase or decrease. They also discuss why this occurs and predict the next steps as they take part in a series of experiments.
Curated OER
Sandia Aerial Tram
Your learners analyze a table of real-life data in order to write an equation that best models the information. Exponential, quadratic, and linear rates of changes are all possibilities in this task.
Curated OER
Environmental Agents of Mathematics: Mathematics for Change
High schoolers analyze environmental science data using Math. They do research about renewable energy, gather data, create graphs and interpret their findings. Then the group presents their arguments persuasively using their findings to...
Mathematics Assessment Project
Journey
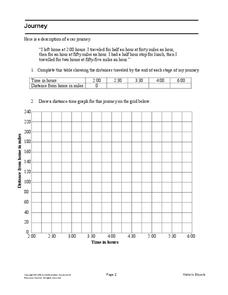
Drive home math concepts with an engaging task. Learners follow a verbal description to fill in a table and create a distance-time graph representing a car journey. They then answer questions by interpreting the graph.
CCSS Math Activities
Smarter Balanced Sample Items: 8th Grade Math – Target F
Functions model relationships between quantities. The Smarter Balanced sample items demonstrate the assessment strategies for eighth grade function modeling standards. Items range from constructing linear functions from a table and a...
Flipped Math
Calculus AB/BC Mid-Unit 1 Review: Limits
Limit the amount one forgets about limits. A mid-unit review lesson has individuals complete a worksheet of problems on limits. They go over the meaning of limits, evaluate limits algebraically, use graphs and tables to find limits, and...
Curated OER
2007 U.S. National Chemistry Olympiad Local Section Exam
Sixty multiple choice questions cover the entire gamut of chemistry concepts. This is the local section of the U.S. National Chemistry Olympiad, where your chemistry candidates take a shot at entering the national competition. They...
Curated OER
Practice with Euler's Method
In this Euler's Method worksheet, students determine the rate of change in given functions They use Euler's Method to approximate the solution of an equation. This two-page worksheet contains approximately twenty problems.
Curated OER
More graphing situations by making a table
Students make a table and graph plotting points. In this algebra lesson, students graph linear equations on a coordinate plane. They calculate the rate of change and analyze the graph for extrapolation.
EngageNY
Comparing Linear Functions and Graphs
How can you compare linear functions? The seventh installment of a 12-part module teaches learners how to compare linear functions whose representations are given in different ways. They use real-world functions and interpret features in...
Charleston School District
Pre-Test Unit 3: Functions
How does an input affect an output? Assess your learners' ability to answer this question using this pre-test. Scholars answer questions about the basics of a function. Topics include determining if a table or statement represents a...
EngageNY
Linear Functions and Proportionality
Connect linear equations, proportionality, and constant rates of change to linear functions. Young mathematicians learn how linear equations of the form y = mx + b can represent linear functions. They then explore examples of linear...
Curated OER
Experiment on Measuring Reaction Rates
Learners investigate the rate of a chemical reaction. In this rate of reactions lesson plan, students use an electronic balance to measure the change in mass of a chemical reaction between hydrochloric acid and calcium carbonate. They...
Curated OER
What Influences Reaction Rate?
Students study reaction rates, what determines how fast a reaction happens and how the chemical changes occur. In this reactions instructional activity students complete a lab where they use Alka-Seltzer to observe reaction rate and...
Wordpress
I Can Find Slope
Your young mathematicians will appreciate this wonderfully organized summary and explanation of linear slope. Approaching slope as it looks in a table of values, on a graph, in an equation, and between two points, this note sheet is...
Curated OER
Writing Equations from a Table
Students use coordinates in a table to write equations. For this algebra lesson, students discuss rate of change as it relates to slope and x and y values. They plot the points from a table to graph their lines and write an equation for...
California Academy of Science
Climate Change Impacts
Getting kids thinking about climate change now, will hopefully push them into action when they become adults. Young environmentalists discuss the evidence and causes of climate change seen in the state of California. They brainstorm ways...
Inside Mathematics
Swimming Pool
Swimming is more fun with quantities. The short assessment task encompasses finding the volume of a trapezoidal prism using an understanding of quantities. Individuals make a connection to the rate of which the pool is filled with a...


