EngageNY
Graphs of Linear Functions and Rate of Change
Discover an important property of linear functions. Learners use the slope formula to calculate the rates of change of linear functions. They find that linear functions have constant rates of change and use this property to determine if...
Curated OER
Exploration 1: Instantaneous Rate of Change Function
In this function activity, students read word problems and write functions. They determine the instantaneous rate of change and identify intervals. This three-page activity contains approximately 20 problems.
Curated OER
Instantaneous Rate of Change of a Function
Pupils draw the graph of a door opening and closing over time. They graph a given function on their calculators, create a table of values and interpret the results by telling if the door is opening or closing and evaluate the average...
Curated OER
Working with Rates of Change
In this calculus worksheet, students problem solve 8 word problems involving rates of change in association with high school students. Students work out each problem and give a short explanation of each answer.
Illustrative Mathematics
Battery Charging
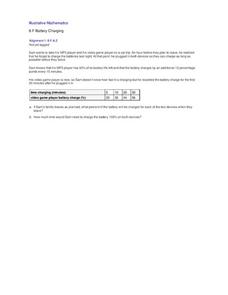
Your class will be very interested in the results of this activity. How long does it take a MP3 and video game player to charge? Sam only has an hour and the MP3 player only has 40% of its battery life left. Plus, his video player is...
Illustrative Mathematics
Video Streaming
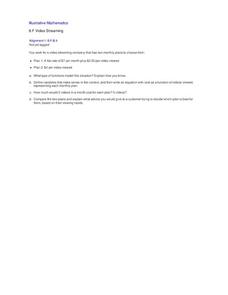
Your movie fans will be interested in this resource. They will compare video streaming plans. One plan charges a set rate per month and a reduced viewing fee, and the other has a flat rate per each video viewed. Unfortunately, students...
Utah Education Network (UEN)
Linear Relationships: Tables, Equations, and Graphs
Pupils explore the concept of linear relationships. They discuss real-world examples of independent and dependent relationships. In addition, they use tables, graphs, and equations to represent linear relationships. They also use ordered...
Curated OER
Lesson #20 Rates of Change and Velocity
Pupils investigate speed. In this rate of change lesson plan, students complete a rate/time/distance table to determine the average m.p.h. of a given trip. They listen and follow along with the lecture and examples to determine the...
EngageNY
Graphs of Simple Nonlinear Functions
Time to move on to nonlinear functions. Scholars create input/output tables and use these to graph simple nonlinear functions. They calculate rates of change to distinguish between linear and nonlinear functions.
Curated OER
The Babylonian Algorithm, Limits and Rates of Change
In this successive approximations worksheet, students use the Babylonian algorithm to determine the roots of given numbers. They identify the limits of a function, and compute the rate of change in a linear function. This two-page...
Kenan Fellows
Man vs. Beast: Approximating Derivatives using Human and Animal Movement
What does dropping a ball look like as a graph? An engaging activity asks learners to record a video of dropping a ball and uploading the video to software for analysis. They compare the position of the ball to time and calculate the...
Curated OER
Equations from Unit Rates
Your class can become linear equations masters, as they calculate the rate of change of a function. They observe different types of coordinates as they relate to a graph, then use the Ti-navigator to move the line around and draw...
Curated OER
Chairs Around the Table
Youngsters become flexible problem solvers with this challenging instructional activity. If there are 24 square tables in a restaurant, how many customers can be seated at one time? They can use manipulatives or draw pictures to help...
Curated OER
Rate and Concentration
Experimental data for a chemical reaction is available in a table. Chemistry cohorts use critical thinking skills to analyze the data and answer questions about reaction rates and reaction order. This activity is neatly formatted,...
Illustrative Mathematics
Find the Change
This exercise is an opportunity for algebra learners to understand the connection between the slope of a line and points found on the line. Use similar triangles to explain why slope m is the same between any two points. Discuss with the...
Curated OER
Changing Planet: Melting Glaciers
Resource links to a video, satellite images, data, and photographs of glaciers provide emerging earth scientists the opportunity to examine how the ice has been retreating over the years. A data table is included for pupils to record...
Curated OER
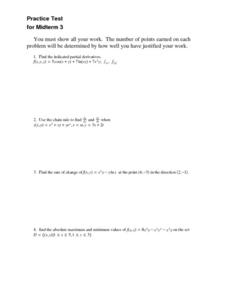
Practice Test: Derivatives
In this derivatives worksheet, students identify the partial derivatives of a function, find the rate of change, and determine the maximum and minimum values of a function. This one-page worksheet contains 6 multi-step problems.
Curated OER
Lessen the Loan
Middle-schoolers explore the concept linear equations. They use the internet to navigate through videos and problems. Pupils problem solve to determine rates of change, slope, and x and y-intercepts.
Curated OER
Rate of Coral Growth
Using a table of information provided, middle school marine biologists chart data on a graph to determine the impact of water depth on coral growth in Australia's Great Barrier Reef. Then they answer questions that connect the data to...
Virginia Department of Education
Linear Modeling
An inquiry-based algebra lesson explores real-world applications of linear functions. Scholars investigate four different situations that can be modeled by linear functions, identifying the rate of change, as well as the strength and...
Natinal Math + Science Initative
Slope Investigation
Context is the key to understanding slope. A real-world application of slope uses a weight loss scenario with a constant rate of change to introduce the concept of slope of a line, before it makes a connection to the ordered pairs and...
Mathematics Vision Project
Quadratic Functions
Inquiry-based learning and investigations form the basis of a deep understanding of quadratic functions in a very thorough unit plan. Learners develop recursive and closed methods for representing real-life situations, then apply these...
Chicago Botanic Garden
Historical Climate Cycles
What better way to make predictions about future weather and climate patterns than with actual climate data from the past? Young climatologists analyze data from 400,000 to 10,000 years ago to determine if climate has changed over time....
Curated OER
Student Costs Data Table
Young scholars compare and contrast two routes selected for a virtual field trip. They create a data table of educational activities, lodging, and meal costs using Microsoft Excel software.


