EngageNY
Methods for Selecting a Random Sample
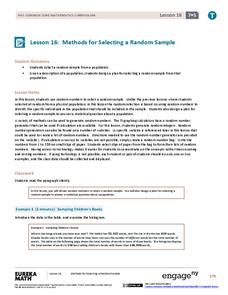
Random sampling is as easy as choosing numbers. Teams use random numbers to create a sample of book lengths from a population of 150 books. The groups continue by developing a technique to create samples to compare from two populations...
CK-12 Foundation
Stratified Random Sampling: An Extracurricular Study
Learning isn't a random process. A well-designed interactive lesson helps classes make key conclusions about stratified random sampling. They calculate group percentages and use those percentages to decide on sampling totals.
CK-12 Foundation
Simple Random Sampling: How Many Samples Does it Take to Change a Light Bulb?
Teach the concept of simple random sampling through an interactive lesson. Learners explore the concept by considering the strength of sampling methods. Size of the samples varies also as individuals determine which methods lead to the...
American Statistical Association
How Random Is the iPod’s Shuffle?
Shuffle the resource into your instructional activity repertoire. Scholars use randomly-generated iPod Shuffle playlists to develop ideas about randomness. They use a new set of playlists to confirm their ideas, and then decide whether...
College Board
Random Variables vs. Algebraic Variables
Variables can vary in meaning. A reference material for AP® Statistics explains the difference between random and algebraic variables. It provides a hypothetical situation involving dice—great for use in a classroom situation.
EngageNY
Random Sampling
Sample pennies to gain an understanding of their ages. The 16th installment of a 25-part series requires groups to collect samples from a jar of pennies. Pupils compare the distribution of their samples with the distribution of the...
EngageNY
Probability Distribution of a Discrete Random Variable
Learn how to analyze probability distributions. The sixth installment of a 21-part module teaches pupils to use probability distributions to determine the long-run behavior of a discrete random variable. They create graphs of probability...
EngageNY
Discrete Random Variables
You don't need to be discreet about using the resource on discrete variables. In the fifth installment of a 21-part module, scholars explore random variables and learn to distinguish between discrete and continuous random variables. They...
Curated OER
Random Statistics
Seventh and eighth graders solve and complete 20 various types of short answer problems. First, they write a brief description of themselves including those as stated. Then, learners categorize the type of sampling used in various...
Curated OER
Random Probability
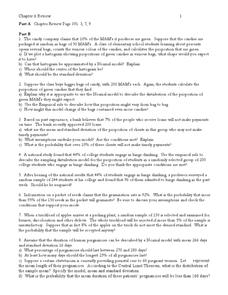
In this statistics and probability worksheet, young statisticians solve and complete 13 different problems related to probability, percentages, and normal distributions. They consider data models, assumptions about the models, and find...
Curated OER
Estimating the Mean State Area
Seventh grade statisticians randomly select five states and then determine the mean area. The class then works together to create a dot plot of their results.
EngageNY
Sampling Variability
Work it out — find the average time clients spend at a gym. Pupils use a table of random digits to collect a sample of times fitness buffs are working out. The scholars use their random sample to calculate an estimate of the mean of the...
CK-12 Foundation
Sums and Differences of Independent Random Variables: Traveling Seasickness
Use a Punnett square to calculate probabilities. The resource presents a situation in which two patients are randomly selected from a group of patients with a particular illness. Pupils use the interactive to determine the likelihood...
Curated OER
Graphing Data
Seventh graders solve and graph 10 different problems that include various questions related to data on a graph. First, they create bar graphs to display the data given. Then, pupils determine the random sample of a population listing...
Illustrative Mathematics
Mr. Brigg's Class Likes Math
A quick discussion question that brings some collaboration into your classroom will allow your thinkers to make a decision about sampling. Mr. Briggs wants to know if the results from his class are a valuable comparison to the entire...
Curated OER
Sampling Bias And the California Recall
Using a 2002 California Gray David recall vote as an example, young statisticians identify sources of bias in samples and find ways of reducing and eliminating sampling bias. They consider ways to select random samples from a...
Illustrative Mathematics
Election Poll, Variation 1
Your class will learn what it means to take a random sample of a population and to draw inferences from the information gained. In part a, of the exercise, you discuss with your class how students during a class election can be best...
Curated OER
Using Random Sampling to Draw Inferences
Emerging statisticians develop the ability to make inferences from sample data while also working on proportional relationships in general. Here, young learners examine samples for bias, and then use random samples to make inferences...
EngageNY
Expected Value of a Discrete Random Variable
Discover how to calculate the expected value of a random variable. In the seventh installment of a 21-part module, young mathematicians develop the formula for expected value. They connect this concept the dot product of vectors.
Statistics Education Web
Sampling in Archaeology
Compare different random sampling types using an archaeological setting. Scholars collect data from an archaeological plot using simple random samples, stratified random samples, systematic random samples, and cluster random samples....
EngageNY
Estimating a Population Proportion
Find the percent of middle schoolers who want the ability to freeze time. The 21st installment in a series of 25 has groups collect a random sample of respondents who answer a question about superpowers. Using sample statistics,...
Statistics Education Web
It’s Elemental! Sampling from the Periodic Table
How random is random? Demonstrate the different random sampling methods using a hands-on activity. Pupils use various sampling techniques to choose a random sample of elements from the periodic table. They use the different samples to...
EngageNY
Conducting a Simulation to Estimate the Probability of an Event II
Add some randomization into simulations. The 11th installment in a series of 25 presents two new methods to use in simulations--colored disks, and random numbers. Pupils use random numbers to run simulations where the probabilities make...
EngageNY
Using Sample Data to Compare the Means of Two or More Populations
Determine whether there is a difference between two grades. Teams generate random samples of two grade levels of individuals. Groups use the mean absolute deviation to determine whether there is a meaningful difference between the...
Other popular searches
- Random Acts of Kindness
- Random Sampling
- Random Numbers
- Random Mutations
- Random Remainders
- Random Number Generators
- Random Sampling Population
- Random Ballots
- Random Samples
- Random Statistics
- Random Search
- Simple Random Sampling


