Curated OER
Designing Samples/Simple Random Samples
Students explore the concept of sampling techniques. In this sampling techniques lesson, students identify possible sources of bias in situations such as phone polls, supermarket surveys, and drawing names from a phone book. Students...
Curated OER
Counting by 3s- Random
In this counting by 3s worksheet, students solve 5 problems in which a chart with a series of numbers is completed by skip counting by 3s. The series of numbers begin with random numbers anywhere between 3 and 100.
Curated OER
Valentine Marbles
if you've ever had to guess how many items were in a jar, then this problem is for you! With a big jar full of red and white marbles, does picking a sample of 16 allow your learners to get a good estimate on the percentages of each...
Curated OER
College Athletes
When more basketball players are taller than field hockey players at a school, is it safe to say that in general they are always taller? The activity takes data from two college teams and your learners will be able to answer questions...
Regents Prep
Activity to Show Sample Population and Bias
There is bias in many aspects of our lives, and math is no exception! Learners explore provided data to understand the meaning of biased and random samples. The resource includes various data sets from the same population, and...
Statistics Education Web
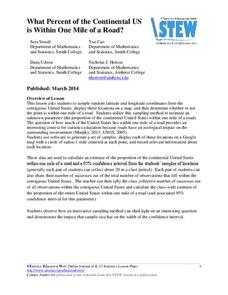
What Percent of the Continental US is Within One Mile of a Road?
There are places in the US where a road cannot be found for miles! The lesson plan asks learners to use random longitude and latitude coordinates within the US to collect data. They then determine the sample proportion and confidence...
Flipped Math
Sampling Methods
Pupils watch a video to learn about different types of sample design and how to use technology to create a random sample. They discover different types of bias that may happen due to the sampling design or the questions. Learners use...
American Statistical Association
How Long Are the Words in the Gettysburg Address?
It's 268 words, but one only needs to consider 10 of them at a time. A data collection and analysis activity has learners investigate the lengths of words in the Gettysburg Address. They first self-select a sample of 10 words and...
EngageNY
Estimating Probability Distributions Empirically 2
Develop probability distributions from simulations. Young mathematicians use simulations to collect data. They use the data to draw graphs of probability distributions for the random variable in question.
EngageNY
Understanding Variability When Estimating a Population Proportion
Estimate the proportion in a population using sampling. The 20th installment in a series of 25 introduces how to determine proportions of categorical data within a population. Groups take random samples from a bag of cubes to determine...
College Board
2014 AP® Statistics Free-Response Questions
Turn a summative assessment into a formative assessment! The 2014 AP® Statistics exam shows learners the level of difficulty they will encounter on their end-of-course exams. Within the six items, the test highlights concepts such as...
Radford University
The Next Big Thing
Make sure the next product is a hit. An engaging task has scholars design an item to sell at a sports event and then conduct a marketing survey. They decide whether to use random sampling, stratified sampling, or cluster sampling, and...
US Department of Commerce
Exploring Sampling Variability - Higher Education Attainment Across The United States
More education in statistics is always beneficial. Given cards that provide the proportion of adults with bachelor's degrees in 10 random US states, scholars individually determine the sample percentage of states in which more than 30...
US Department of Commerce
Sample Means - Exploring Sampling Variability
Sample an excellent resource on sampling variability. Pupils analyze census data on the percentage of homes in each state that have Internet access. They take random samples of different sample sizes, determine the sample means, and then...
Discovery Education
Fuss About Dust
Dust is everywhere around us; it's unavoidable. But what exactly is dust and are certain locations dustier than others? These are the questions students try to answer in an interesting scientific investigation. Working independently or...
Math Word Problems
Math Word Problems - Random Math Related Quizzes
One of the hardest things for children to learn when dealing with word problems is to determine what is being asked. This activity provides 5 basic addition and subtraction word problems, each contains a follow-up question which helps...
Curated OER
Probability as a Decimal
In this probability as a decimal worksheet, students determine the probability of a number as a decimal. They draw a marble at random from a jar and calculate the probability given. Then, students roll a die numbered from 1 to 6 and...
Curated OER
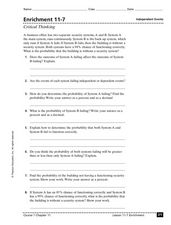
Independent Events
For this independent events probability worksheet, students solve 10 different problems that include determining the probability of certain events described. First, they determine the probability of selecting at random a number divisible...
Curated OER
Probability
In this probability worksheet, 8th graders solve 10 different problems that include determining a probability of events as a percentage. First, they determine the probability that a marble drawn will be green. Then, students determine a...
Curated OER
The Statistics Sampler
Learners define sample, describe a random sample, and discuss what compromises a sample. They determine a sample size to estimate a population characteristic with confidence.
Curated OER
Probability With a Random Drawing
Students define probability, and predict, record, and discuss outcomes from a random drawing, then identify most likely and least likely outcomes. They conduct a random drawing, record the data on a data chart, analyze the data, and...
Curated OER
Designing Models to Simulate Actual Events Using a Table of Random Digits
Students design models to simulate actual events using a tale of random digits. They estimate the likelihood of a particular outcome using results of simulation. Students investigate the uses of statistical methods to analyze data.
Illustrative Mathematics
Random Walk III
Don't cross the line; just walk along it. Scholars investigate a scenario in which a person starts at zero on a number line, then moves left or right depending on a flip of a coin. They determine the number of outcomes for six flips,...
Curated OER
Ideas That Lead to Probability
Learners explore and define the concept of probability. They utilize a random number generator to determine the fairness of a game. Internet and printable versions fo the activities are included.
Other popular searches
- Random Acts of Kindness
- Random Sampling
- Random Numbers
- Random Mutations
- Random Remainders
- Random Number Generators
- Random Sampling Population
- Random Ballots
- Random Samples
- Random Statistics
- Random Search
- Simple Random Sampling


