EngageNY
Fluency with Percents
Pupils build confidence working with percents as they work several types of percent problems to increase their fluency. The resource contains two sets of problems specifically designed to build efficiency in finding solutions of basic...
EngageNY
Word Problems
Use several skills to solve word problems leading to systems of equations. Scholars define variables and write equations to model situations described within word problems. Pupils solve the resulting system of linear equations using...
EngageNY
Solving Problems by Finding Equivalent Ratios II
Changing ratios make for interesting problems. Pupils solve problems that involve ratios between two quantities that change. Groups use tape diagrams to represent and solve classroom exercises and share their solutions.
EngageNY
Problem Solving When the Percent Changes
Use more than one whole to solve percent problems. The ninth installment in a 20-part series has pupils work percent problems in which they must determine two wholes. Individuals use double number lines to represent and solve the...
EngageNY
Geometric Interpretations of the Solutions of a Linear System
An intersection is more than just the point where lines intersect; explain this and the meaning of the intersection to your class. The 26th segment in a 33-part series uses graphing to solve systems of equations. Pupils graph linear...
EngageNY
Two-Step Problems—All Operations
Step 1: Use the resource. Step 2: Watch your class become experts in solving two-step problems. Scholars learn to solve two-step word problems in context. They use tape diagrams and algebraic techniques to break the problem into two,...
Illustrative Mathematics
Maria’s Marbles
Ali has more marbles than Maria in some of these word problems, while in others Maria has more marbles than Ali. First graders are tasked to read each word problem and solve how many marbles each girl has.
EngageNY
End-of-Module Assessment Task: Grade 7 Mathematics Module 4
Asses the class to determine their knowledge of proportional relationships involving percents. Class members work through the nine-question assessment with a variety of percent problems. The multi-step problems involve simple interest,...
Mathed Up!
Angles in Polygons
Show your class that finding angle measures is a regular calculation with a resource that provides 12 problems dealing with the measures of angles in regular polygons. Pupils use formulas for the sum of measures of angles in a polygon to...
Illustrative Mathematics
Voting for Three, Variation 1
This is an opportunity for young mathematicians to apply reasoning to solve real-world problems with ratios. Even though there are three candidates for class president, young scholars will only consider two at a time, making the first...
Curated OER
2004 U.S. National Chemistry Olympiad Part I
In this chemistry worksheet, test takers answer 60 multiple choice questions on topics related to chemistry from balancing equations to calculating moles and molecules of compounds. They name formulas, they convert, they solve problems...
Illustrative Mathematics
Building toward fluency
Here is a great learning task that focuses on the development of areas in computational fluency including strategies in mental math. Young learners are guided through a list of addition expressions that help them visually understand the...
California Education Partners
Summer Olympics
Quickly get to the decimal point. The last assessment in a nine-part series requires scholars to work with decimals. Pupils compare the race times of several athletes and calculate how much they have improved over time. During the second...
Mathed Up!
Fractions of an Amount
After viewing a video on fractional amounts, young mathematicians put their new knowledge to the test. Throughout the assessment, class members find the fractional amount for prices, times, and populations. There are a few percent and...
EngageNY
Estimating Probabilities by Collecting Data
Take a spin to determine experimental probability. Small groups spin a spinner and keep track of the sums of the spins and calculate the resulting probabilities. Pupils use simulated frequencies to practice finding other probabilities to...
Illustrative Mathematics
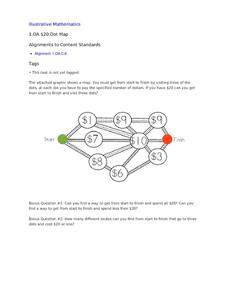
$20 Dot Map
Challenge the addition skills of young learners with this open-ended math problem. The task is simple, get from start to finish by connecting a series of three numbers. The trick is that the sum of the numbers must be less than...
Illustrative Mathematics
Shrinking
Is Aunt Nancy shrinking? Find out by calculating with the average height women lose each year. The activity practices multiplying and dividing with decimals and rounding the final answer.
Mathed Up!
Probability
How likely is it to draw a blue marble? Pupils find the likelihood of events and connect that to the probability of the event. They find the probabilities of simple events and show their probabilities on a scale.
Illustrative Mathematics
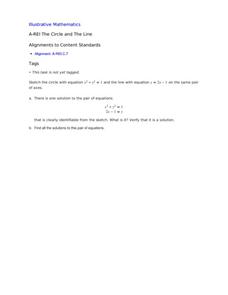
The Circle and The Line
Here is a resource where algebra learners show their understanding of a system of equations involving a circle and a line. Once graphed, learners see two points of intersection, one where the ordered pair is read, and a second where...
Illustrative Mathematics
Gifts from Grandma, Variation 3
There are three money word problems in this activity, each one is set in the same context. The first asks what was the total amount grandma spent, the second how many grandchildren grandma has, and the third asks how much grandma spent...
CCSS Math Activities
Smarter Balanced Sample Items: 8th Grade Math – Claim 3
Communication is the key. A dozen sample items require scholars to communicate their reasoning involved in arriving at a solution. The PowerPoint from the Gr. 8 Claim 2 - 4 Item Slide Shows series uses a variety of content to...
California Education Partners
Least and Greatest
Squares can be magic. Pupils use their knowledge of addition of positive and negative rational numbers to create a 3 X 3 magic square where the sums are 1. Scholars create addition and multiplication expressions with a set of rational...
Inside Mathematics
Population
Population density, it is not all that it is plotted to be. Pupils analyze a scatter plot of population versus area for some of the states in the US. The class members respond to eight questions about the graph, specific points and...
Noyce Foundation
Ducklings
The class gets their mean and median all in a row with an assessment task that uses a population of ducklings to work with data displays and measures of central tendency. Pupils create a frequency chart and calculate the mean and median....
