College Board
2008 AP® Statistics Free-Response Questions Form B
To know what is on the test would be great. The six free-response question from the second form of the 2008 AP® Statistics gives pupils an insight into the format and general content of the exam. Each question requires the test...
Curated OER
Plant Diversity and Distribution
Learners construct a defined plot on school grounds and observed patterns in plant life. They count trees, shrubs, cacti and record on a data sheet. They compare data and generate a plant diversity overlook for their school.
Illustrative Mathematics
Should We Send Out a Certificate?
Fred thinks his test score is high enough to earn him a certificate. Given the mean and standard deviation, use properties of normal distributions to calculate Fred's percentile ranking and see if he is right. Consider having your class...
American Statistical Association
Don't Spill the Beans!
Become a bean counter. Pupils use a fun activity to design and execute an experiment to determine whether they can grab more beans with their dominant hand or non-dominant hand. They use the class data to create scatter plots and then...
Inside Mathematics
Snakes
Get a line on the snakes. The assessment task requires the class to determine the species of unknown snakes based upon collected data. Individuals analyze two scatter plots and determine the most likely species for five...
Curated OER
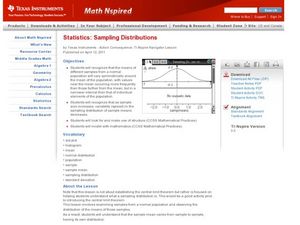
Sampling Distributions
Students analyze sampling from different population. In this statistics lesson plan, students define the meaning of sample sizes and what causes an increase or decrease. They graph their data on the Ti calculator and draw conclusion from...
Curated OER
Population Vs Consumption: Which is a Bigger Problem for the Environment & Who is Getting the Lion's Share of the World's Resources?
Students develop critical thinking and awareness about the complexity of natural resource use, wealth distribution, population densities, poverty, and the environment. They think about people living in different parts of the world and...
Curated OER
SC Populations Along Major Interstates
Students examine the population among the interstates in South Carolina. Using the internet, they identify the counties and roads and compare it with their own drawing.
Statistics Education Web
Walk the Line
How confident are you? Explore the meaning of a confidence interval using class collected data. Learners analyze data and follow the steps to determine a 95 percent confidence interval. They then interpret the meaning of the confidence...
Illustrative Mathematics
Why Randomize?
Your statisticians draw several samplings from the same data set, some randomized and some not, and consider the distribution of the sample means of the two different types of samplings. The exercise demonstrates that non-random samples...
Illustrative Mathematics
Do You Fit In This Car?
A short activity that focuses on the normal distribution as a model for data distribution. Using given means and standard deviations, your budding statisticians can use statistical tables, calculators, or other statistical software to...
Curated OER
Cartogram of the Great Compromise
Young scholars create cartograms of populations during 1790.
Curated OER
Topography of Africa
Students study Africa's diverse landscape and investigate how these features impact the available water supply, food sources, and population distribution of the continent. They compare topographical features and
their affect on each...
College Board
2007 AP® Statistics Free-Response Questions Form B
So that is how they do it! Pupils and teachers see how College Board assesses topics using the free-response questions from Form B of the 2007 AP® Statistics test. The six questions are divided in two sections, the first five being...
Curated OER
TE Activity: The Great Divide
Students simulate the distribution of nonrenewable energy resources using cookies. They determine how the world's growing population effects the equitable distribution of these resources. They look at how engineers work to develop...
Curated OER
Take Me Out To the Ball Game
Young scholars use a map to graph and locate major league teams of different sports. In groups, they analyze the population data of the United States and compare it with the amount and location of the major league teams. They share their...
Curated OER
Bald Eagle Population Graphing
Students create graphs to illustrate the bald eagle population. They identify the population of bald eagles in Minnesota and the United States. They create three graphs to represent the population data including a line, bar, and...
Curated OER
What Are We Going To Do About Baby Six Billion?
Students formulate and evaluate suggestions about government policy using demographic examples and projections. They examine websites and utilize worksheets imbedded in this plan.
Curated OER
Chapter 6: The Human Population: Demographics
Students read the indicated text and complete several suggested labs and activities. They answer critical thinking questions. This instructional activity is very hard to do without the indicated text.
Curated OER
Population Counts
Students use 2001 population figures to color provinces and territories on a map. They use the information on their map to answer questions.
Curated OER
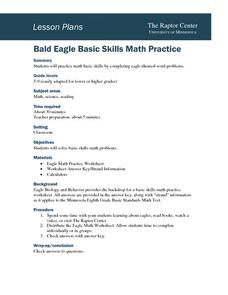
Bald Eagle Basic Skills Math Practice
Pupils solve basic skills math problems involving eagles. They read and discuss facts about eagles and view a video. They complete the Eagle Math worksheet and check their answers. They create additional problems and solve them.
Curated OER
I Feel Renewed!
Students participate in a simulation of the equal and unequal distribution of the earth's renewable resources. They discuss renewable resources and how food resources can increase and decrease, participate in the simulation, and analyze...
Curated OER
The World is a Village
Students observe Americans through the eyes of the world. In this human population lesson plan, students utilize the Internet to view the World Pop Clock and follow the world's population by the minute. Students predict what...
Curated OER
Hypothesis Testing: Two Sample Tests
Students experiment and compare results of two populations. In this men and women populations lesson plan, students examine the difference in hand span for men and women. Students calculate a norm based on their...


