Curated OER
Long Island Beach Life
Have your class learn about marine life through this resource. This comprehensive lesson has learners discuss marine life, learn key vocabulary, discuss environmental concerns, and play games related to migration and predator/prey...
Curated OER
Handwriting Template
In need of a printable handwriting worksheet? Here are 10 lines available for your special needs pupil to write on. Great for many uses and almost any population.
National Wildlife Federation
Gator Hole Graphics
Climate changes are cyclic so how do these changes impact species that live in different habitats? Learners examine the rainfall levels in a specific swamp habitat. They also review graphical data and tell a story about how the...
National Wildlife Federation
Build a Bat House!
Bats usually get a bad rap. Scholars learn about the importance of bats and the threat their declining population has on the environment. They then build bat houses to attract and welcome bats into the area.
Curated OER
Wheel of Trouble
While teaching about endangered species, you can incorporate this activity as a take-home reminder of what is threatening the sea turtle population. It is one of those paper plate projects in which a wedge is cut out to reveal a picture...
Media Smarts
First Person
High schoolers explore the relationship between video games and actual population. Example: A 2005 study showed Latino youth play at higher rates than other groups, but there are no Latino playable characters. They watch a brief video...
American Statistical Association
Scatter It! (Predict Billy’s Height)
How do doctors predict a child's future height? Scholars use one case study to determine the height of a child two years into the future. They graph the given data, determine the line of best fit, and use that to estimate the height in...
Polar Trec
Temperature Profile above the South Pole
Collecting and understanding data is a big part of understanding the world and how it changes. To better grasp what temperatures are changing and how they affect global populations, learners create a graph based on the date provided....
Illustrative Mathematics
Election Poll, Variation 1
Your class will learn what it means to take a random sample of a population and to draw inferences from the information gained. In part a, of the exercise, you discuss with your class how students during a class election can be best...
University of Kentucky
The Great Spider Debate
Poor, misunderstood spiders! They are feared, disrespected, and detested by many people, yet they do so many positive things. A great addition to any insect unit, learn about some of the more common spiders, while hopefully dispelling...
Ask a Biologist
Desert Tortoise
The desert tortoise is a protected species, and it's population in some areas, such as Joshua Tree State Park in California, has been rapidly declining over the years. Invite your young biologists to study the Desert Tortoise...
Khan Academy
Challenge: Constellation Maker
Populate your own universe with constellations and stars. Modify the existing JavaScript code to use the push method of arrays, and mouseX and mouseY to draw a star based on the click and position of the mouse.
Curated OER
College Athletes
When more basketball players are taller than field hockey players at a school, is it safe to say that in general they are always taller? The activity takes data from two college teams and your learners will be able to answer questions...
Curated OER
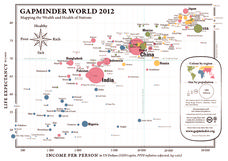
Gapminder World 2012
Here is a very interesting infographic that compares the average life expectancies, per capita incomes, and population sizes of every country in the world in 2012.
Curated OER
State Notebooking Pages
Studying US states in your class? Then this note-taking page is perfect for you! Pupils can fill in information about a chosen state in the provided and labeled spaces. By the time they've filled out all the boxes, they'll know the...
Sea World
Arctic Animals
Discover the coldest animals in the world with a lesson about the Arctic habitat. Kids use a glossary and information sheet about animals found in the Arctic Circle to complete several activities, including tracking the lemming...
Mathed Up!
Fractions of an Amount
After viewing a video on fractional amounts, young mathematicians put their new knowledge to the test. Throughout the assessment, class members find the fractional amount for prices, times, and populations. There are a few percent and...
Bowland
Speedy Santa
Santa sure is fast. In the assessment task, learners calculate the number of minutes Santa can spend at each house. This calculation requires the use of given population demographics data.
WindWise Education
Can We Reduce Risk to Bats?
It is just batty! A resource outlines a case study scenario of reducing the risk to bats. Teams learn about the bat populations in the area of the wind farm, then research and propose a solution.
Polar Trec
Bering Sea Fabulous Food Chain Game
In spring, the Bering Sea turns green due to phytoplankton, which live at the surface, experiencing a population explosion. Groups of scholars play a food chain game, writing down food chains as the game is played. After five to six...
Energy for Keeps
Renewable Energy Action Project: What's in Your Energy Portfolio?
Uncover the renewable energy potential in your region. The activity outlines an approach to research current practices and trends. Learners conduct surveys to assess the attitudes of the local population and prepare a paper summarizing...
NOAA
What Killed the Seeds?
Can a coral cure cancer? Take seventh and eighth grade science sleuths to the underwater drugstore for an investigation into emerging pharmaceutical research. The fifth installment in a series of six has classmates research the wealth of...
Nature Works Everywhere
Sharks and Shorelines
Examine predator-prey marine relationships through an interactive lesson plan design. Learners begin by studying a specific shark species and then analyze real-time shark-tracking data. They also study threats to shark populations and...
CK-12 Foundation
Sampling Distribution of a Sample Mean: The Mean of the Average Ages
What does it mean to take the mean of the mean? An easy-to-use interactive has users adjust the mean ages of different samples. Finding the average of these sample means gives an estimate of the population mean.
Other popular searches
- Population Ecology
- Population Genetics
- Population Density
- Population Biology
- Population Growth
- Population Geography
- Human Population
- World Population
- Population Distribution
- Aging Population
- Populations and Ecosystems
- Human Population Growth


