Curated OER
Four Decimal, Fraction, and Percent Activities
In this fraction activity, students solve problems presented in four different activities. The activities cover percentages, fractions, decimals, currency exchange, and value added tax. A card "game" is one of the activities. Partial...
EngageNY
Markup and Markdown Problems
There is a 100 percent chance this resource will help pupils connect percents to financial literacy. Young mathematicians use their knowledge of percents to find markups and markdowns in financial situations in the seventh segment in a...
Noyce Foundation
Snail Pace
Slow and steady wins the race? In the assessment task, scholars calculate the rates at which different snails travel in order to find the fastest snail. Hopefully, your class will move much more quickly in finishing the task!
Federal Reserve Bank
What Do Financial Market Indicators Tell Us?
Explain the four categories of financial indicators (commodity prices, stock indexes, interest rates, and yield spreads), and help your class members understand how changes in this data can affect decisions regarding consumer spending,...
Curated OER
Percent Application Worksheet
In this problem solving worksheet, students solve each of the ten word problems by using their knowledge of percent, proportions, simple interest, and sales tax.
Curated OER
Exothermic vs. Endothermic
The PowerPoint opens with video footage of the decomposition of nitrogen triiodide and then explains it with diagrams. Graphs of exothermic and endothermic reactions are exhibited, as well as one for the effect of a catalyst on reaction...
National Council of Teachers of Mathematics
National Debt and Wars
Take a functional approach to the national debt. Learners collect information about the national debt by decade and plot the data. They determine whether an exponential curve is a good fit for the data by comparing the percent changes...
CK-12 Foundation
Prices Involving Sales Tax: Proper Tipping
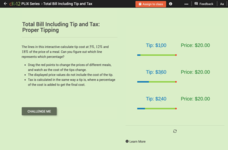
A five-question interactive challenges mathematicians to find a correct tip and total amount using percents five, 12, and 18. A tool with moveable pieces assists participants in locating answers. Types of questions include...
Global Oneness Project
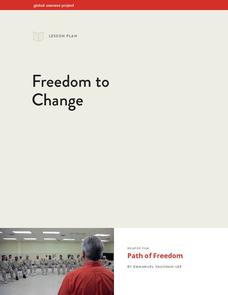
Freedom to Change
Here's something unusual and thoughtful: have your scholars do some pensive reflection themselves before tackling how such meditative techniques are used in prison rehabilitation programs. They watch the "Path of Freedom" video found...
Balanced Assessment
Oil Consumption
An assessment presents a chart displaying oil consumption Pupils use the chart to determine the greatest increase in consumption, and then apply that information to figure out when the consumption may reach 100 million barrels a day.
Inside Mathematics
Squares and Circles
It's all about lines when going around. Pupils graph the relationship between the length of a side of a square and its perimeter. Class members explain the origin in context of the side length and perimeter. They compare the graph to the...
Bowland
Torbury Festival
Have you been to Torbury Fair? In the set of four lessons, learners solve a myriad of problems related to a music festival, including situations involving floods, market stalls, cows, and emergency plans.
Curated OER
Images of Our Changing Earth
Students identify and explain that remote sensing can detect changes on the Earth's surface that occur over time, and name at least three: urbanization, deforestation, and succession. They select a global change issue to investigate and...
Curated OER
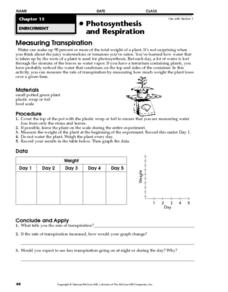
Measuring Transpiration
In this transpiration learning exercise, students will conduct an experiment to measure the rate of transpiration from a plant by measuring how much weight the plant loses over 5 days. Students will record their data and create a graph...
Curated OER
Gender Equity in the Classroom
Learners review employment statistics and wages over the past 20 years. They examine the Federal Work Force Laws. They apply formulas to find the rate of change in the minimum wage.
Illustrative Mathematics
Accuracy of Carbon 14 Dating II
The scientific issue of carbon-14 dating and exponential decay gets a statistics-based treatment in this problem. The class starts with a basic investigation of carbon content, but then branches out to questions of accuracy and ranges of...
Delaware Health and Social Services
My Life. My Plan: Women
Nationwide, over 40 percent of pregnancies are unintended. A lesson designed for women of childbearing age asks them to consider their goals and provides information about reproductive health. Learners view a PowerPoint presentation and...
Beyond Benign
Municipal Waste Generation
Statistically, waste may become a problem in the future if people do not take action. Using their knowledge of statistics and data representation, pupils take a look at the idea of waste generation. The four-part unit has class members...
Rochester Institute of Technology
Skateboard Assembly - Line Balance
Utilize the instructional activity on utilization. The second installment of a nine-part technology/engineering series teaches scholars about the flow of a balanced assembly line and the definition of utilization. Videos, activities, and...
Balanced Assessment
Presidential Popularity
Media often misrepresent data and statistics to their advantage. This lesson asks scholars to analyze an article with misleading statistics. They use margin of error and mean data in their studies. Once they complete their analysis,...
National Nanotechnology Infrastructure Network
Lab 1: Nanocatalysts Clean Your Car Emissions
What a big job for such a small particle. Young scientists learn about the role of nanoparticles in catalytic converters for cars. They conduct an experiment to create alginate-MnO2 catalytic spheres.
CCSS Math Activities
Smarter Balanced Sample Items: 7th Grade Math – Claim 2
To solve or not to solve that is the problem. A slide presentation of 17 items show different ways that Smarter Balanced assesses Claim 2, problem solving. The items span from sixth and seventh grade concepts to highlight the...
CK-12 Foundation
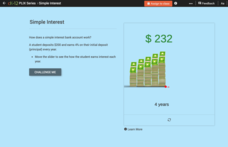
Simple Interest
Mathematicians manipulate a mountain of money to solve six questions about simple interest. Question types include several multiple-choice and one discussion.
Curated OER
60-30-10
Students use ratios and proportions to represent quantitative relationships as they investigate the concept of how percentages are used by designers. Students decorate the same room using three different percentages of colors.


