EngageNY
Connecting Graphical Representations and Numerical Summaries
Which graph belongs to which summary statistics? Class members build upon their knowledge of data displays and numerical summaries to connect the two. Pupils make connections between different graphical displays of the same data in the...
Curated OER
Comparing Fractions with the Same Numerators, Assessment Variation
Have your class demonstrate their ability to compare fractions with this short multiple-choice assessment. Using the fractions 9/8 and 9/4, the students first make comparisons using both words and the greater than/less than signs. Next,...
National Security Agency
Multiple Representations of Limits
After an introductory activity to demonstrate the theory of a limit, additional activities approach a limit from graphical, numerical, and algebraic methods. The activity looks at the multiple ways of understanding and evaluating a limit.
Curated OER
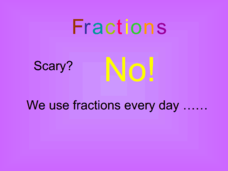
Fractions
Fractions are scary for a lot of young mathematicians. This cute presentation tries to take the "scary" out of fractions. The basics are covered: the numerator, the denominator, and the fact that a fraction is a representation of a part...
Curated OER
Flash Fractions
The first few slides in this resource describe the parts of a fraction. Then, learners view various representations of a few given fractions. They complete an activity where they assess images to determine a specific part/whole...
Curated OER
TI-Nspire Activity: What Does Your Representation Tell You?
By learning to select the best representation for three meal plans, students compare three meal plans to determine the best choice. Data for the meal plans is sorted on a table, as an algebraic equation, and graphed on a coordinate grid....
EngageNY
Describing Center, Variability, and Shape of a Data Distribution from a Graphical Representation
What is the typical length of a yellow perch? Pupils analyze a histogram of lengths for a sample of yellow perch from the Great Lakes. They determine which measures of center and variability are best to use based upon the shape of the...
Curated OER
Fractions
This simple, yet effective, presentation should give your learners good practice in identifying fractions based on a pictured representation. The pictures are varied, and the denominators are more than just the standard 1/4, 1/3, and 1/2.
Association for Supervision and Curriculum Development (ASCD)
Interpreting Algebraic Expressions
The title of this lesson should be "Algebraic Expressions Four Ways." Not only will your class be translating verbal descriptions of algebraic expressions to symbols, but also working with their geometric interpretation via area as well...
Curated OER
Pythagorean Theorem by Graphic Manipulation
There are many different ways to show a proof of the Pythagorean Theorem. Here is a nice hands-on paper cutting activity that shows a graphic representation. You can even challenge your young Pythagoreans to come up with their own...
Curated OER
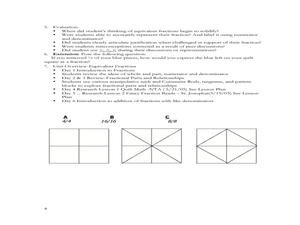
Half Math Quilt
Help your third graders become familiar with equivalent fractions for one-half by having them create a quilt. They will use triangles to create a quilt of equivalent fractions over a period of 6 days. As they create the quilt pieces they...
Pennsylvania Department of Education
Analyzing Numeric and Geometric Patterns of Paper Pool
Students use concrete and pictorial representation of geometric patterns to extend patterns. In this geometric patterns lesson plan, students identify patterns and extend them.
Curated OER
Numerical Analysis: Machine Representation of Numbers
In this machine representation of a number worksheet, students explore definitions such as floating-point, round-off error, binary representation of a number, mantissa, and sign bit. They identify significant digits and determine how...
Mathematics Assessment Project
Representing the Laws of Arithmetic
Sixth graders connect numerical expressions to geometric area. They first complete an assessment task requiring them to identify area models for numerical expressions. Learners then participate in an activity to match area models to...
Noyce Foundation
Toy Trains
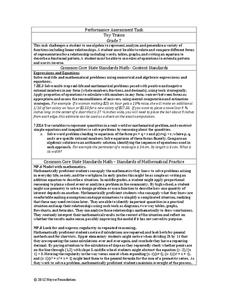
Scholars identify and continue the numerical pattern for the number of wheels on a train. Using the established pattern and its inverse, they determine whether a number of wheels is possible. Pupils finish by developing an algebraic...
Louisiana Department of Education
Fractions, Decimals, and Percents
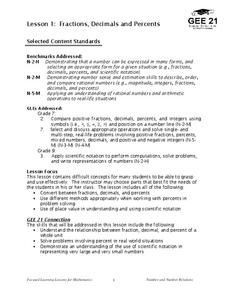
Fractions, decimals, and percents all say the same thing! Show your classes how to convert between the three forms using visual and numeric representations. Then lead them to an understanding of scientific notation.
Bob Prior
The Order of Operations
Your learners use many different number representations like positive and negative integers, exponents, radicals, and combinations of operations as they learn and strengthen their use of the order of operations. Thoughtfully organized to...
College Board
Engaging the Intuition in Statistics to Motivate
Motivation is key to learning. The author points out that it is important to engage intuition for aspects of statistics that pupils find counter-intuitive. Three strategies—using multiple representations, using intuitive analogies, and...
Curated OER
Inquiry Unit: Modeling Maximums and Minimums
Young mathematicians explore the maximun area for patio with the added complexity of finding the mimimum cost for construction. First, they maximize the area of a yard given a limited amount of fence and plot width v. area on a scatter...
EngageNY
Part of a Whole as a Percent
Pupils use visual models, numeric methods, and equations to solve percent problems. To complete the second installment of 20, they find the part given the percent and the whole, find the percent given the part and the whole, and find the...
EngageNY
Understanding Box Plots
Scholars apply the concepts of box plots and dot plots to summarize and describe data distributions. They use the data displays to compare sets of data and determine numerical summaries.
EngageNY
Summarizing a Data Distribution by Describing Center, Variability, and Shape
Put those numbers to work by completing a statistical study! Pupils finish the last two steps in a statistical study by summarizing data with displays and numerical summaries. Individuals use the summaries to answer the statistical...
CK-12 Foundation
Understand and Create Histograms: Car Sales
Create a history of car sales. Pupils create a histogram/bar graph to show the number of car sales made during the week. Using the data display, learners calculate numerical summaries of the data and find the percent of cars sold during...
Math Antics
Fractions Are Parts
Cut it up into parts and make fractions. The short video provides a definition of fractions as being a representation of parts of a whole. Using drawings, the presentation shows how to determine the bottom and top numbers for a fraction...


