Kenan Fellows
Half-Life
Scholars shake their way to understanding half-life with the help of candy. They observe and record which side candy lands on to graph the exponential decay in the fifth lesson of seven integrating chemistry and algebra. Combining...
Curated OER
What's the Scoop?: Our Favourite Ice Cream Flavours
Sixth graders create a spreadsheet on the favorite ice cream flavors of their peers. They interview their classmates, documenting their findings on a "Favorite Flavors" spreadsheet. Students graph and analyze the data.
Curated OER
The Very Hungry Caterpillar
Read the story, The Very Hungry Caterpillar, and complete activities from multiple subjects. Make a mural, create a class graph, discuss the life cycle of a butterfly, research information about butterflies on the Internet and make...
Illustrative Mathematics
Color Week
Practice counting by ones up to 20 with your kindergartners using this colorful class experiment. There are two versions for the lesson. Version 1: The Friday beforehand, send home a notice for the week assigning a different color for...
Sea World
Splash of Math
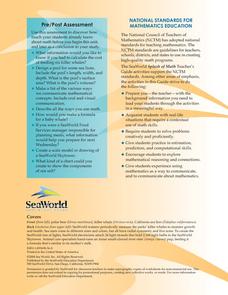
How can kids use math to learn about marine life? Combine math skills with science lessons in a resource featuring activities about life in the sea. Kids graph and calculate data, solve complex word problems, measure geometric shapes,...
Kent State University
How Does that Work?
Sixth and seventh graders explore algebra word problems. They work with a partner to solve word problems distributed by e-mail. Learners simplify mathematical expressions following a "think aloud" algebra strategy modeled by the teacher....
Curated OER
Basketball Rebounds
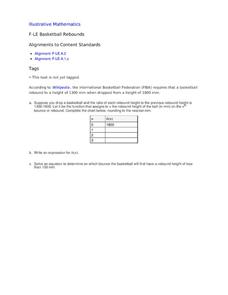
Your young basketball players will build a table and develop a general formula for a decaying exponential scenario involving the rebound distance of a bouncing ball. Using a CBR and graphing calculator can make this even more hands-on...
Ohio Department of Education
Writing and Comparing Numbers in Scientific Notation-Grade Eight
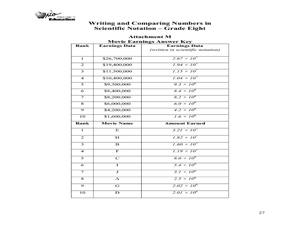
Explore scientific notation in this mathematics lesson. Young mathematicians explore multiple representations of large number in scientific notation through the use of models, visual representation and expanded form. The lesson provided...
Illustrative Mathematics
Paying the Rent
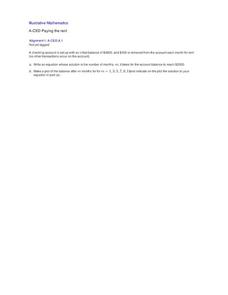
Learning how a bank account works is a useful tool. The exercise in the resource is to deduct rent from a checking account and create an equation from a description. Participants then graph the balance of the bank account versus months...
Curated OER
Does the Sidewalk Drink Puddles?
Young scholars participate in an experiment about evaporation. In this water cycle lesson plan, students use water, thermometers, and measuring tools to make a puddle and measure the size four times throughout the day. Young scholars...
NASA
Connecting Models and Critical Questions
Scholars use data to analyze and determine which sets of information need to be counted. They create a model to explain differences among chemical elements using graphs to prove concept mastery.
Kenan Fellows
Weight and Balance of an Airplane
A career in aeronautics might be calling your class members. Building from the previous two lessons in the series, learners continue analyzing the mathematics of aeronautics. Groups create a paper airplane using paperclips for balance....
Curated OER
Linguistic Diversity. Languages in Canada - Elementary
Create a language mosaic to reveal the linguistic diversity in your community. Pupils interview a person with a home language other than English and contribute to a bulletin board display representing the variety of languages spoken. The...
Curated OER
Matrix Operations
Two real-world activities to practice adding, subtracting and multiplying matrices to problem solve. Data from several Pro football quarterbacks is used in one activity to make some predictions based on their stats. Then the class takes...
Curated OER
In Touch with Apples
Students read "How To Make an Apple Pie and See the World", the story of a girl who traveled the world to find the ingredients to make her apple pie. They conduct a series of interdisciplinary activities including testing their senses,...
Illustrative Mathematics
Function Rules
Function machines are a great way to introduce the topic of functions to your class. Here, you will explore the input and output to functions both using numerical and non-numerical data. Learners are encouraged to play with different...
Alabama Learning Exchange
Building Functions: Composition of Functions
Hammer away at building different types of functions. An engaging lesson builds on learners' knowledge of domain and range to create an understanding of composite functions. Young scholars learn to write composite functions...
Curated OER
How Different Are We from Other Students?
Fifth graders make bar graphs from data that they have collected. They have been writing to pen pals in Spain for a couple of months and received a survey back from them. They put all the data together that they collected.
Curated OER
Exploring Scale
Sixth graders discuss how the scale and type of graph can change how the data appears. With a partner, they identify all the information about the graph in a specific amount of time and record them in a journal. To end the lesson plan,...
Curated OER
Surveying During a Basketball Game
Tenth graders conduct a survey at a high school basketball game. They compile and present the data as histograms or bar graphs.
Curated OER
McCadam's Quarterly Report
Fourth graders problem solve a problem from a local business using data, generating graphs, and draw conclusions. They submit their findings in a business letter format with feed back from a company's plant manager.
Curated OER
Tony's Spelling Troubles
Young scholars are introduced to the given problem and describe in their own words the situation represented in a bar chart and tally chart. They then use a bar chart and tally chart to make sensible predictions.
Curated OER
Math & Social Science
Learners are given data and are to calculate averages and yearly totals of how many cars travel the Tacoma Narrows Bridge. They also make a graph of the data.
Pennsylvania Department of Education
Eye to Eye
Students practice the concept of posing mathematical questions regarding themselves and their surroundings. In this eye to eye lesson, students gather data about eye color from their classmates. Students organize their data in order to...


