Curated OER
Senior Analysis: Graphing Rational Functions
Budding mathematicians graph given functions, identify the asymptotes, graph absolute values, and write a table of points. This three-page learning exercise contains 23 problems.
Curated OER
Graphing
In this graphing worksheet, students solve and graph 10 different problems that include determining various coordinates and the slope. First, they use the table to write the x and y coordinates for each point on the graphs. Then,...
Curated OER
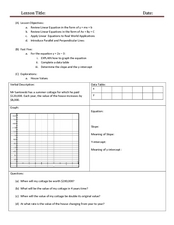
Review Linear Equations
Explore algebra I/algebra II with this series of worksheets. Pupils write linear equations in slope-intercept and standard form, graph linear equations, and apply linear equations to real world applications. The six-page worksheet...
Illustrative Mathematics
Chocolate Bar Sales
In this real-world example, algebra learners start to get a sense of how to represent the relationship between two variables in different ways. They start by looking at a partial table of values that define a linear relationship. They...
Curated OER
Sunshine Math--3: Mars, II
Students practice solving mathematical word problems. In this math worksheet, they solve one probability problem, write in the missing numbers in a table, solve one mental math problem and interpret two graphs.
Curated OER
Sunshine Math- 1 Venus, III
In this problem solving learning exercise, students complete 7 problems that include: reasoning, basic operations, graphs, tables, geometry and math puzzles.
Curated OER
How Does Water Cool?
How fast does water cool? First fifth graders will draw a line on a graph that predicts how fast they think water can cool from boiling. Then they plot the actual data on the same graph to see if their estimate was correct.
California Education Partners
Linflower Seeds
How does your garden grow? Use proportions to help Tim answer that question. By using their understanding of proportional relationships, pupils determine the number of seeds that will sprout. They create their own linear...
Virginia Department of Education
Road Trip
Help plan a road trip with linear equations. Scholars consider two different rental car companies and write equations representing the cost for each company. They graph the system of equations to determine the conditions under which each...
Old Dominion University
Introduction to Calculus
This heady calculus text covers the subjects of differential and integral calculus with rigorous detail, culminating in a chapter of physics and engineering applications. A particular emphasis on classic proof meshes with modern graphs,...
California Education Partners
Colorful Data
Scale up your lessons with a performance task. Young data analysts work through an assessment task on scaled bar graphs. They answer questions about a given scaled bar graph on favorite colors, analyze a bar graph to see if it matches...
Willow Tree
Linear Relationships
There's just something special about lines in algebra. Introduce your classes to linear equations by analyzing the linear relationship. Young mathematicians use input/output pairs to determine the slope and the slope-intercept formula to...
Curated OER
Frequency Histograms, Bar Graphs and Tables #3
In this frequency histograms instructional activity, students examine bar graphs, histograms and tables. They identify the model of information that best matches the statistics. This three-page instructional activity cotnains...
Curated OER
My Test Book: Reading Graphs
In this online interactive math skills worksheet, students solve 10 multiple choice math problems that require them to read and interpret graphs. Students may view the correct answers.
Curated OER
Using A Table
In this table worksheet, students observe information in a table, and then answer ten questions pertaining to the information. They must correctly read a table in order to arrive at the correct answer. Questions pertain to features of...
Curated OER
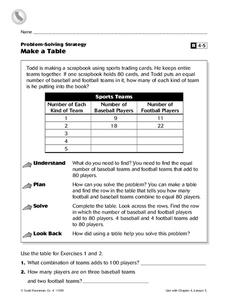
Make a Table
For this charting worksheet, 4th graders complete a table. Using the information provided, students fill in the missing data and complete 2 short answer questions.
Curated OER
Using Parallel Axes To Discover Mathematical Interconnections
In this math worksheet, middle schoolers graph the functions on parallel axes and observe the location of the slope point in relation to the x and y axes.
Mathed Up!
Cumulative Frequency and Box Plots
Learn how to display data. Young data analysts watch a video to review how to create cumulative frequency histograms and box plots. They work on a set of questions to practice producing these data displays.
Curated OER
Linear Relations
In this linear relations worksheet, students complete a table for given functions. They classify graphs as linear or non-linear. Students graph given equations. They compare and contrast graphs. This nine page worksheet contains five...
Illustrative Mathematics
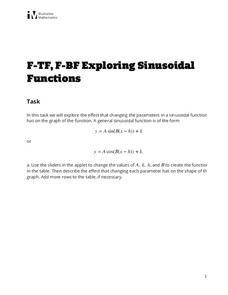
Exploring Sinusoidal Functions
What effect does changing a parameter have on the graph of a trigonometric function? Pupils use a Desmos applet to explore the general sine graph. They experiment changing different parameters and record the resulting change of the...
Illustrative Mathematics
Walk-a-thon 1
Your mathematician's job is to explore the relationship between hours and miles walked during a walk-a-thon. The activity compels your learners to experiment with different means in finding out this proportional relationship. The answer...
Curated OER
Survey of Height
In this data collection worksheet, students survey the heights of their fellow classmates, organize their data in a data table, and create a bar graph from their data. Once bar graph is completed, students complete 2 short answer...
Illustrative Mathematics
Walk-a-thon 2
During a walk-a-thon your learners must determine the walking rate of Julianna's progress. Using tables, graphs, and an equation, they must be able to calculate the time it took her to walk one mile and predict her distance based on the...
Inside Mathematics
Coffee
There are many ways to correlate coffee to life, but in this case a worksheet looks at the price of two different sizes of coffee. It requires interpreting a graph with two unknown variables, in this case the price, and solving for...


