Concord Consortium
Rational and Not So Rational Functions
Do not cross the line while graphing. Provided with several coordinate axes along with asymptotes, pupils determine two functions that will fit the given restrictions. Scholars then determine other geometrical relationships of asymptotes...
Balanced Assessment
Telephone Service
Class members must determine the best phone plan for customers. by assessing three different phone plans. Each plan price depends not only the number of minutes, but also the location of the calls — bringing in a third variable. Scholars...
Curated OER
Graphing From Function Tables
In this graphing from function tables instructional activity, students graph given functions from a completed function table. This is a instructional activity generator, the teacher can set the grid size for plotting points as well as...
Curated OER
Graphing Applications
In this graphing applications worksheet, learners derive equations for 4 word problems. Students then define variables, find intercepts, graph the equations, and interpret the slopes.
Curated OER
Graphing
In this algebra worksheet, students make a table and graph their linear equations. There are 4 problems to be solve by find x and y values.
Curated OER
Long Distance Phone Plans
In this long distance phone plane worksheet, students compare various phone plans and determine which long distance plan has the greatest savings. Students support their answers visually through the use of tables and graphs. They write...
Curated OER
Slope, Intercepts, and Graphing a Line
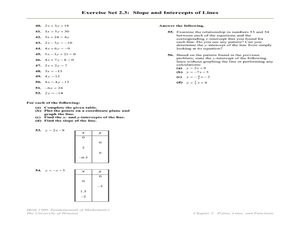
In this intercepts and slope worksheet, students find the slope and/or the x and y-intercepts in fifty-three problems. Students also graph lines using the x and y-intercepts.
Curated OER
Graphing and Analyzing
For this graphing and analyzing worksheet, 9th graders first state if each graph represents a linear or nonlinear relationship. Second, they create a difference table for each set of data presented and determine whether it represents a...
Curated OER
Problem-Solving Application: Make a Circle Graph
In this circle graphs activity, students analyze a data table about the activities in a day. Students then use this data to make a circle graph. Students answer 6 questions about the graph.
Curated OER
Graphing Ordered Pairs
Here is graphing worksheet which has pupils graph ordered pairs and label the axis. They graph five ordered pairs and then interpret the data in the graph.
Curated OER
Graphs of Formulas
In this worksheet students fill out a function table after reading a short word problem. This is a good way for students to practice the necessary skills for solving word problems or setting up algebra equations.
Curated OER
Line Graphs
In this line graphs worksheet, 8th graders solve and complete 20 different problems that include reading various line graphs. First, they use the information provided in each line graph to determine the correct response to each of the...
Curated OER
Double Bar Graphs (Reteach 15.1)
In this graphs worksheet, students analyze the data on two double bar graphs. Students answer 4 questions about the information on the graphs.
Curated OER
Problem Solving: Use a Table Reteach 16.8
In this problem solving worksheet, learners learn to look for information in a data table. Students answer 6 questions about a data table.
Curated OER
Graphing Quadratic Functions
In this graphing quadratic functions worksheet, students create a function table and graph quadratic functions. This four-page worksheet contains 33 problems. A graph is supplied with each function. One example is provided at the...
Curated OER
Practice: Word Problems
Congratulations, you've just hit the word problem jackpot! Covering an incredible range of topics from integers and fractions, to percents, geometry, and much more, this collection of worksheets will keep young mathematicians...
Flipped Math
Unit 1 Review: Analyze Graphs and Expressions
Get in one last practice. Pupils work through 12 problems and a performance task to review the topics in Unit 1. The problems cover analyzing and modeling with graphs, algebraic properties of equality, and adding, subtracting, and...
Illustrative Mathematics
Fixing the Furnace
This comprehensive resource applies simultaneous equations to a real-life problem. Though the commentary starts with a graph, some home consumers may choose to begin with a table. A graph does aid learners to visualize the shift of one...
Curated OER
Sunshine Math 3
In this word problems instructional activity, learners read and problem solve nine mathematical word problems involving grids, measurement, compensation and angles.
EngageNY
Finding One Hundred Percent Given Another Percent
Class members solve problems to find the whole when given a percent. They use double line numbers and factors of hundred to help break the 100 percent into equal segments.
Curated OER
M&M Science and Math
A series of math and science activities feature M&M's® as manipulatives to help kids work through equations. The resource includes exercises on finding averages, percent of compositions, moles in chemical reactions, genotypes and...
Pingry School
Gas Pressure and Volume Relationship
Do your high school scientists know the four methods scientists use to communicate information? A simple experiment discovering the relationship between gas pressure and volume allows pupils to practice all four. After completing the...
Open Text Book Store
Arithmetic for College Students: Worksheets
Loaded with concepts ranging from multiplying decimals to converting units to solving problems using the order of operations, a thorough practice packet is perfect for a fifth or sixth grade math classroom.
Curated OER
Graphing Linear Functions Two
Use this graphing linear functions worksheet to have learners graph three linear equations. They use a table of values, the intercept method, and slope-intercept form to graph three functions.


