Noyce Foundation
First Rate
Explore distance and time factors to build an understanding of rates. A comprehensive set of problems target learners of all grade levels. The initial problem provides distance and time values and asks for the winner of a race. Another...
Concord Consortium
Be Well
How much do you spend on healthcare each year? Data shows the expenditures in the US rise significantly each year. Young scholars use the data to calculate a rate of change over a 30-year period and look for—as well as provide— possible...
College Board
2007 AP® Calculus BC Free-Response Questions Form B
There is just a single real-world problem. Released free-response items from the 2007 AP® Calculus BC Form B contains only one real-world question. The question involves rate of change of wind chill scenario. The mathematical problems...
CK-12 Foundation
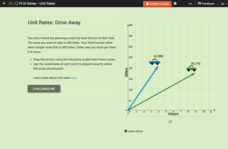
Comparison of Unit Rates: Drive Away
Five questions make up an interactive that challenges mathematicians to compare unit rates. Word problems question scholars about two friends going on a road trip. Scholars manipulate two cars on a coordinate plane to help solve word...
Flipped Math
Calculus AB/BC - Introduction to Related Rates
Here's a video for those who can relate to being confused about related rates. The fourth of eight lessons in Unit 4 - Contextual Applications looks at related rates. Individuals learn to write equations that show a relationship between...
CCSS Math Activities
Smarter Balanced Sample Items: 8th Grade Math – Target F
Functions model relationships between quantities. The Smarter Balanced sample items demonstrate the assessment strategies for eighth grade function modeling standards. Items range from constructing linear functions from a table and a...
Natinal Math + Science Initative
Slope Investigation
Context is the key to understanding slope. A real-world application of slope uses a weight loss scenario with a constant rate of change to introduce the concept of slope of a line, before it makes a connection to the ordered pairs and...
Curated OER
Algebra 1: Slope as Rate
Students solve problems with slopes. In this algebra lesson, students identify the slope of a line and relate it to the rate of change. They graph their lines on the TI and observe changes in the lines.
EngageNY
Euler’s Number, e
Scholars model the height of water in a container with an exponential function and apply average rates of change to this function. The main attraction of the instructional activity is the discovery of Euler's number.
Project Maths
Introduction to Calculus
Don't let your class's heart rates rise as you introduce them to differentiation ... an inquiry-based instructional activity helps them keep it in check! The second instructional activity in a three-part series asks learners to analyze...
EngageNY
Graphs of Simple Nonlinear Functions
Time to move on to nonlinear functions. Scholars create input/output tables and use these to graph simple nonlinear functions. They calculate rates of change to distinguish between linear and nonlinear functions.
EngageNY
Constant Rates Revisited
Find the faster rate. The resource tasks the class to compare proportional relationships represented in different ways. Pupils find the slope of the proportional relationships to determine the constant rates. They then analyze the rates...
Mathematics Vision Project
Quadratic Functions
Inquiry-based learning and investigations form the basis of a deep understanding of quadratic functions in a very thorough unit plan. Learners develop recursive and closed methods for representing real-life situations, then apply these...
Kenan Fellows
Man vs. Beast: Approximating Derivatives using Human and Animal Movement
What does dropping a ball look like as a graph? An engaging activity asks learners to record a video of dropping a ball and uploading the video to software for analysis. They compare the position of the ball to time and calculate the...
Curated OER
Worksheet 14 - Rates
In this rate worksheet, students draw and label given situations, determine the rates and the relationship between them. This two-page worksheet contains 7 multi-step problems.
Curated OER
Linear Functions: Slope, Graphs, and Models
This math packet provides an opportunity for learners to graph two linear equations on a coordinate grid and determine the slope and y-intercept of each. They use the equation of five lines to find the slope and y-intercepts, and then...
Curated OER
Polly and the Shapeshifter
Students analyze the patterns in polygons and relate it to the rate of change. In this algebra lesson, students discuss the relationship between the data and the graph of the data.
Curated OER
Rate of Change
For this calculus worksheet, students calculate the rate of change in an isosceles trapezoid. They take the derivative to find their answer.
Curated OER
Dragonfly
The speed of a dragonfly brings math into the real world as your learners collaboratively see the value in calculating unit rates in direct proportion problems. This six-phase lesson encourages you, as the teacher, to only ask questions...
EngageNY
From Rates to Ratios
Look at rates from a general perspective. The 17th part of a 29-part series provides problems that help pupils develop more general ratios from given rates. Scholars determine unit rates and ratios that are associated with given rates....
Curated OER
The Effect of Math Anxiety on Cardiovascular Homeostasis
Using a pulse monitor, learners will measure a resting pulse, take a math test, and then measure the pulse again. They analyze the change in pulse and compare it to performance on the test. This multi-purpose lesson can be used in a...
CK-12 Foundation
Applications Using Linear Models: Scuba Diving
Dive into this resource on rates of change and linear models. Pupils use two sliders in an interactive to adjust water temperature and depth. They use a given linear equation to calculate the rate of change in water temperature per unit...
Utah Education Network (UEN)
Linear Graphs Using Proportions and Rates
Using a TI-73 or other similar graphing calculator middle school math majors investigate the linear relationship of equivalent proportions. After a brief introduction by the teacher, class members participate in a timed pair share...
Curated OER
Equations from Unit Rates
Your class can become linear equations masters, as they calculate the rate of change of a function. They observe different types of coordinates as they relate to a graph, then use the Ti-navigator to move the line around and draw...


