Mascil Project
Circular Pave-Stones Backyard
Pack the lesson into your plans. Young mathematicians learn about packing and optimization with the context of circular paving stones. They use coins to model the paving stones, and then apply knowledge of circles and polygons to...
Curated OER
The Minority Majority
Students design a census class and school, then tabulate the results. They respond to a sample census, then reflect on why questions of race and national origin are different.
Curated OER
Creating a Thematic Map
Students create and analyze a weather-related data table and a thematic map based upon information provided.
Curated OER
How Credit Card Interest Works
Young scholars experiment with an Excel spreadsheet model that demonstrates the effects of interest on payments. They calculate actual costs, interest paid, and time necessary to pay off credit purchases and draw conclusions about the...
Curated OER
Common Procedure Costs
Kids never think about the cost of medical expenses, because they never think they'll get hurt. To better understand personal financial planning, learners research common medical procedures and their costs. They use a worksheet and the...
Willow Tree
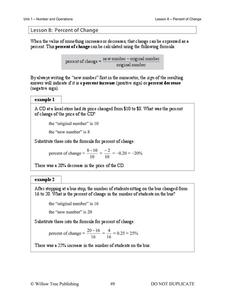
Percent of Change
Your car decreases in value from $20,000 to $17,000. What percent of the value have you lost? Pupils answer word problems by determining the percent of change.
Willow Tree
Simple Probability
The probability of learning from this lesson is high! Learners calculate probabilities as numbers and as decimals. They see how to use a complement to find a probability and even try a simple geometric probability problem.
Balanced Assessment
Dart Boards
Bulls eye! Design dart boards with specific chances of winning. Individuals determine the probability of hitting a circular and a triangular dart board inscribed in squares. They create dart boards that have a 50 percent chance of...
Balanced Assessment
Stock Market
Analyze trends in the stock market using histograms. Future economists use data presented in a histogram to find periods of greatest increase and decrease. They also draw conclusions about days that would be best to invest.
Balanced Assessment
Dog Tags
Class members demonstrate a proficiency with conditional probabilities through this task. Individuals calculate probabilities using multiplication and addition. They also distinguish between repetition and non-repetition while...
Curated OER
Voter Turnout
Explore politics by analyzing the voting process. Pupils discuss the purpose of casting votes in an election, then examine graphs based on the data from a previously held election's turnout. The lesson concludes as they answer study...
Statistics Education Web
Walk the Line
How confident are you? Explore the meaning of a confidence interval using class collected data. Learners analyze data and follow the steps to determine a 95 percent confidence interval. They then interpret the meaning of the confidence...
Illustrative Mathematics
Should We Send Out a Certificate?
Fred thinks his test score is high enough to earn him a certificate. Given the mean and standard deviation, use properties of normal distributions to calculate Fred's percentile ranking and see if he is right. Consider having your class...
Curated OER
Minutes and Days
Elapsed time is a skill developed by the single question that is the center of this activity. Fifth graders are asked to find out the time that is 2011 minutes after the beginning of 2011. This question addresses the standard that...
Illustrative Mathematics
Lake Algae
Introduce learners to exponential growth with this real-world problem about algae that is rapidly spreading across a lake in a city park. The task presents the rate of growth and an end value and asks learners to determine what happened...
Curated OER
Unit Squares and Triangles
This is an interesting geometry problem. Given the figure, find the area of a triangle that is created by the intersecting lines. The solution requires one to use what he/she knows about coordinate geometry, as well as triangle...
Curated OER
T Points from Directions
Here is a lesson plan that starts with having geometers translate points using compass directions into an accurate picture of the problem. Then they must use their knowledge of the Pythagorean theorem or similar triangles to solve. This...
Illustrative Mathematics
Sammy's Chipmunk and Squirrel Observations
Here is a fun project. Sammy observes a chipmunk and a squirrel to see how many holes each needs in order to stash the same number of acorns. Scholars could find the answer algebraically or create a table to analyze the...
Illustrative Mathematics
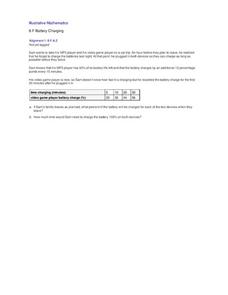
Battery Charging
Your class will be very interested in the results of this activity. How long does it take a MP3 and video game player to charge? Sam only has an hour and the MP3 player only has 40% of its battery life left. Plus, his video player...
Illustrative Mathematics
Area of a Trapezoid
Here is a straightforward example of how to apply the Pythagorean Theorem to find an unknown side-length of a trapezoid. Commentary gives additional information on proving that the inside of the trapezoid is a rectangle, but is...
Illustrative Mathematics
Comparing Years
Who knew that the Egyptian, Julian, and Gregorian year were different lengths? Your mathematicians will! They will have to calculate the difference between the years in seconds and find the percent change. Using dimensional analysis,...
Illustrative Mathematics
Two-School Dance
Who's ready for the dance? When two middle schools combine for a dance, your learners' job is to calculate the ratio of girls attending. Provided with three different solutions, you can choose from setting up a ratio, linear equation, or...
Illustrative Mathematics
Dana's House
Your class is to find the percent of the lot that is not covered by a house. Make sure your pupils understand the problems before they begin. The lot is the whole of the percent problem and the house is the part. The exercise is good...
Illustrative Mathematics
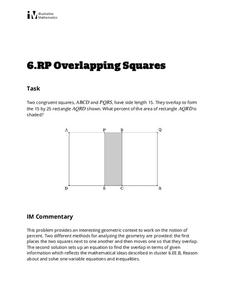
Overlapping Squares
The objective of this activity is to find the percent of the area of a two squares overlapping. Mathematicians find the ratio of area for the part that overlaps to the rectangle formed. The final answer is a percent as a rate per 100....
Other popular searches
- Percentages and Math
- Calculator Math Percentages
- Learning Math Percentages
- Math Percentages Diagram
- Teaching Percentages in Math
- Math Percentages Ecology
- Math Percentages Decimals
- Teaching Math Percentages
- Football Math Percentages
- Everyday Math Percentages
- Converting Math Percentages
- Math Percentages Jerry P


