Curated OER
Direct, Inverse and Joint Variation
Eleventh graders identify, create and solve word problems involving inverse variation. In this algebra lesson, 11th graders solve problems using direct, inverse and joint variation. They identify problems using these methods.
Curated OER
Paper Bag Skits
Students discover math measurements by creating a skit with classmates. In this geometry lesson, students utilize objects in a paper bag and index cards to create a short skit focusing on debate over the size of the objects....
Curated OER
Discovering Ohm's Law
Connect math with science! Pupils apply properties of Ohms Law as they solve problems and identify the inverse relationship of a function. They analyze the shape of the graph of an inverse function and use it to make predictions.
Curated OER
Introduction to Representing and Analyzing Data
Represent data graphically. Allow your class to explore different methods of representing data. They create foldables, sing songs, and play a dice game to reinforce the measures of central tendency.
Curated OER
Oodles of Noodles
Students investigate non-standard and standard measurement including inches and centimeters. They use different types of noodles as non-standard units of measurement comparing them to inches and centimeters.
Rainforest Alliance
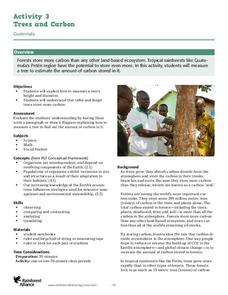
Trees and Carbon
You'll find everything but the kitchen sink here ... or just a carbon sink. In the activity, pairs or groups of middle school learners go outside and measure a tree's circumference and height to estimate its carbon storage potential and...
Curated OER
Extending the Definitions of Exponents, Variation 2
Introduce the concept of exponential functions with an activity that extends the definition of exponents to include rational values. Start with a doubling function at integer values of time, then expand table to include frational time...
Curated OER
Basketball Bounces, Assessment Variation 2
This un-scaffold summative assessment tasks learners to use the height of a bouncing basketball, given the data in graph and table form, to choose the model that is represented. Learners then use the model to answer questions about...
Curated OER
Basketball Bounces, Assessment Variation 1
This highly scaffolded, summative assessment tasks learners to choose the model that represents the height of a bouncing basketball given the data in graph and table form. Learners then use the model to answer questions about the...
Utah Education Network (UEN)
Statistics
Find the value in analyzing data values. Statistics is the focus in the fifth of seven installments of the 6th Grade Math series. Individuals learn to examine dot plots, histograms, and box plots by considering the shape, mean, median,...
Curated OER
Winter-time Temps
Young scholars measure temperature and become aware the the temperature above and below the snow is different. In this winter temperature lesson, students measure temperatures to find variation based on how the snow is packed....
Curated OER
Map Your School
Learners participate in a project to map their school. They measure and graph various areas around the school. Students find the longitude and latitude of the school and research the school's history, and highlight special important areas.
Curated OER
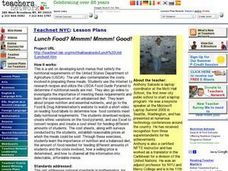
Lunch Food? Mmmm! Mmmm! Good!
Examine how nutrition plays an important role in our lives by conducting online research and developing lunch menus that satisfy nutritional requirements set up by the United States Department of Agriculture. Students download recipes,...
Virginia Department of Education
Analyzing and Interpreting Statistics
Use measures of variance to compare and analyze data sets. Pupils match histograms of data sets to their respective statistical measures. They then use calculated statistics to further analyze groups of data and use the results to make...
College Board
2007 AP® Statistics Free-Response Questions Form B
So that is how they do it! Pupils and teachers see how College Board assesses topics using the free-response questions from Form B of the 2007 AP® Statistics test. The six questions are divided in two sections, the first five being...
Curated OER
Direct and Inverse Variation
For this direct and inverse variation worksheet, 9th graders solve 10 different problems that include various situations in variations. First, they find the constant of proportionality when given each variable measure. Then, students...
Curated OER
Our School - Our Trees
Sixth graders observe school ground trees planted nearly 3 decades ago. For this ecology lesson, 6th graders examine a group of trees planted near their campus and measure the diameter, circumference and growth of the tree compared...
Illustrative Mathematics
Seven Circles III
A basic set-up leads to a surprisingly complex analysis in this variation on the question of surrounding a central circle with a ring of touching circles. Useful for putting trigonometric functions in a physical context, as well as...
Curated OER
Variation
In this variation worksheet, students interpret and organize data. They find the distance between points. Students use ratios to determine volume This six-page worksheet contains approximately 20 problems. Answers...
Curated OER
Migrating Math
Students practice estimating distance traveled while walking. Also can be used to introduce backpacking/hiking or as a daily warm-up. Measure the blacktop/cafeteria/playground, then determine how many times around make a mile.
Curated OER
Size Riddles
Young scholars investigate shapes and sizes by creating a riddle. In this geometry lesson, students read one of two books and investigate facts about an object's size. Young scholars write a riddle using the facts they have...
Curated OER
Find Someone
Your class will participate in a series of math vocabulary activities to learn about parallel lines. They find people using a math list and connect math words in the context of sentences. They also read the math words in the example...
EngageNY
Describing Distributions Using the Mean and MAD II
The 11th lesson in the series of 22 is similar to the preceding lesson, but requires scholars to compare distributions using the mean and mean absolute deviation. Pupils use the information to make a determination on which data set is...
Georgia Department of Education
The Basketball Star
Have learners use math to prove they are sports stars! Assess a pupil's ability to create and analyze data using a variety of graphs. The class will be motivated by the association of math and basketball data.


