Curated OER
The Greedy Triangle-Intro to Geometric Shapes
In this geometry lesson, learners read The Greedy Triangle and use geoboards to construct geometric shapes. They identify the number of sides and angles each shape has.
EngageNY
Choice of Unit
Explore using units with scientific notation to communicate numbers effectively. Individuals choose appropriate units to express numbers in a real-life situation. For this 13th lesson of 15, participants convert numbers in scientific...
Noyce Foundation
Lawn Mowing
This is how long we mow the lawn together. The assessment requires the class to work with combining ratios and proportional reasoning. Pupils determine the unit rate of mowers and calculate the time required to mow a lawn if they work...
McGraw Hill
Triangles
After reviewing characteristics of seven types of triangles, young geometers discover how to find the missing angle of a triangle. Then, they practice identifying triangles, find missing angles, and find missing side lengths of similar...
Curated OER
Physical Science: Festival of Bubbles
Investigate bubbles through the use of scientific inquiry. Pupils blow bubbles using several methods and measure the resulting bubble print. Measurements are recorded on a data table and transferred to a bar graph. Results are discussed...
Virginia Department of Education
Balancing Act
How many different interpretations of the mean are there? Scholars place numbers on a number line and determine the mean. They interpret the mean as the average value and as the balance point.
Curated OER
Learning about gravity
Learn how to measure weight with newtons in a science experiment about gravity. After they read a short paragraph about force, fifth graders draw an arrow to indicate which way a spring is being pulled. Next, they survey their family...
Inside Mathematics
Rhombuses
Just what does it take to show two rhombuses are similar? The assessment task asks pupils to develop an argument to show that given quadrilaterals are rhombuses. Class members also use their knowledge of similar triangles to show two...
Noyce Foundation
Pizza Crusts
Enough stuffed crust to go around. Pupils calculate the area and perimeter of a variety of pizza shapes, including rectangular and circular. Individuals design rectangular pizzas with a given area to maximize the amount of crust and do...
EngageNY
Describing Distributions Using the Mean and MAD II
The 11th instructional activity in the series of 22 is similar to the preceding instructional activity, but requires scholars to compare distributions using the mean and mean absolute deviation. Pupils use the information to make a...
EngageNY
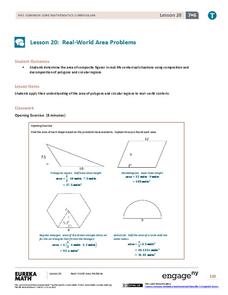
Real-World Area Problems
Not all structures take the shape of a polygon. The 21st lesson in a series of 29 shows young mathematicians they can create polygons out of composite shapes. Once they deconstruct the structures, they find the area of the composite figure.
Virginia Department of Education
Surface Area and Volume of a Cylinder
Surface area or volume? Pupils first review the difference between surface area and volume. They then use a two-dimensional net that helps them develop formulas for the surface area and volume of cylinders.
EngageNY
Conversion Between Celsius and Fahrenheit
Develop a formula based upon numerical computations. The 31st part of a 33-part unit has the class determine the formula to convert a temperature in Celsius to a temperature in Fahrenheit. They do this by making comparisons between the...
EngageNY
Converse of the Pythagorean Theorem
Discover a new application of the Pythagorean Theorem. Learners prove and apply the converse of the Pythagorean Theorem in the 17th lesson in a 25-part series. The examples ask learners to verify right triangles using the converse of the...
EngageNY
Finding a Rate by Dividing Two Quantities
Develop the right station to solve rate word problems. The 18th lesson in a series of 29 starts by interpreting the aspects of rates with two different quantities. Pupils use the interpretation of rates to solve problems, and groups work...
Inside Mathematics
Vencent's Graphs
I like algebra, but graphing is where I draw the line! Worksheet includes three multiple-part questions on interpreting and drawing line graphs. It focuses on the abstract where neither axis has numbers written in, though both are...
EngageNY
Using Sample Data to Compare the Means of Two or More Populations
Determine whether there is a difference between two grades. Teams generate random samples of two grade levels of individuals. Groups use the mean absolute deviation to determine whether there is a meaningful difference between the...
EngageNY
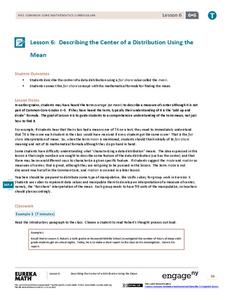
Describing the Center of a Distribution Using the Mean
Everyone does their fair share. The sixth segment in a 22-part unit presents the mean as a fair share. Groups build a conceptual understanding of the mean of a data set, rather than simply learn an algorithm. Learners use the...
EngageNY
Understanding Box Plots
Scholars apply the concepts of box plots and dot plots to summarize and describe data distributions. They use the data displays to compare sets of data and determine numerical summaries.
EngageNY
Creating a Histogram
Display data over a larger interval. The fourth segment in a 22-part unit introduces histograms and plotting data within intervals to the class. Pupils create frequency tables with predefined intervals to build histograms. They describe...
EngageNY
Describing a Distribution Displayed in a Histogram
The shape of the histogram is also relative. Learners calculate relative frequencies from frequency tables and create relative frequency histograms. The scholars compare the histograms made from frequencies to those made from relative...
Curated OER
Minutes and Days
Elapsed time is a skill developed by the single question that is the center of this activity. Fifth graders are asked to find out the time that is 2011 minutes after the beginning of 2011. This question addresses the standard that...
Virginia Department of Education
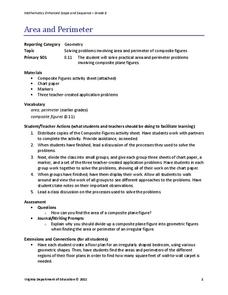
Area and Perimeter
Develop a strategy for finding the area and perimeter of irregular figures. Building on an understanding of finding area and perimeter of rectangles and triangles, learners apply the same concepts to composite figures. After practicing...
Curated OER
Double-the-Design Yarn Paintings!
Learners cut yarn into several different lengths and fold paper in half, using skills for measuring and fractions. Then they use unconventional items (yarn) as tools to create mirror-image art and experience first-hand the math idea of...


