Concord Consortium
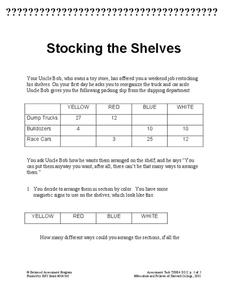
Stocking the Shelves
How many ways can you stock a shelf? It's probably more than you think! Young scholars use data in a frequency table to determine how many ways to stock a shelf given a specific constraint for types of groups. They then repeat the task...
Statistics Education Web
First Day Statistics Activity—Grouping Qualitative Data
Making groups of groups can help to organize data. Classes use statistics to group themselves using descriptive adjectives. The objective is for learners to understand that grouping qualitative data is useful when the original groups are...
Achieve
Ivy Smith Grows Up
Babies grow at an incredible rate! Demonstrate how to model growth using a linear function. Learners build the function from two data points, and then use the function to make predictions.
Education Development Center
Interpreting Statistical Measures—Class Scores
Explore the effect of outliers through an analysis of mean, median, and standard deviation. Your classes examine and compare these measures for two groups. They must make sense of a group that has a higher mean but lower median compared...
Virginia Department of Education
Attributes of a Rectangular Prism
A change is coming. Pupils use unit cubes to investigate how changes in the length, width, and/or height affects volume and surface area. They extend the results to write and test predictions on the effect of changing multiple sides on...
Curated OER
Using Tables
In this using tables worksheet, 9th graders solve and complete 10 various types of problems that include using tables to determine information. First, they write an equation to determine the total amount. Then, students define each of...
Curated OER
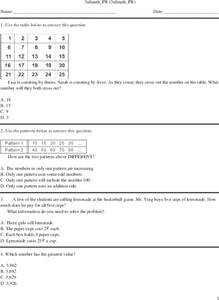
3rd grade math review
In this math review instructional activity, 3rd graders answer multiple choice questions about patterns, addition, least to greatest, and more. Students complete 20 questions.
Curated OER
Number Sense and Numeration: Multiples, Factors and Square Roots
A great resource for any math teacher covering multiples, factors or square roots; this worksheet walks young mathematicians through the logic behind factoring and square roots with a systematic set of problems which gradually increase...
World Wildlife Fund
Arctic Shapes
In a two-part learning exercise, young geometers examine 3-D shapes and describe their attributes in a table. They will be able to draw the shape and name the number of vertices, faces, and edges. In the second part, individuals...
World Wildlife Fund
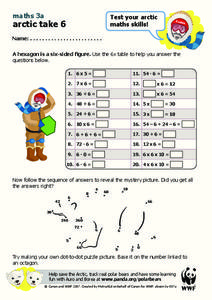
Arctic Take 6
The magic number is six! Using a 6x table, young math stars practice adding, subtracting, multiplying, and dividing two-digit numbers with the number six. This worksheet also touches on making tessellations with hexagons.
Illustrative Mathematics
Who Has the Best Job?
Making money is important to teenagers. It is up to your apprentices to determine how much two wage earners make with their after school jobs. Participants work with a table, an equation, and a graph and compare the two workers to see...
Illustrative Mathematics
Gotham City Taxis
Taxi! Have your travelers figure out how far they can go in a taxi for $10.00. They must account for the mileage rate and tip in their calculation. They can set up a table or make an equation to solve for the exact mileage they can...
Illustrative Mathematics
The Djinni’s Offer
The djinni in this resource offers gold coins. Learners use the properties of exponents to make their decision as one offer increases exponentially. This makes a great group project. As the commentary suggests, start by having groups...
Illustrative Mathematics
Bake Sale
Put math into action with the real-life scenario of a bake sale. The participants at this bake sale are ready to divide their fresh-baked cookies into bags. It is up to your number crunchers to help decide how many cookies should go in...
Balanced Assessment
Stick Patterns
Sticks and stones may break my bones, but these sticks will make me smarter. Pupils examine arrays of sticks to determine the next array in a pattern. They use the number of sticks added to each previous array to determine a recursive...
Willow Tree
Weighted Averages
Mixtures, weighted percentages, and varying speeds make problem solving difficult. The resource give learners a strategy for tackling these types of problems effectively.
Illustrative Mathematics
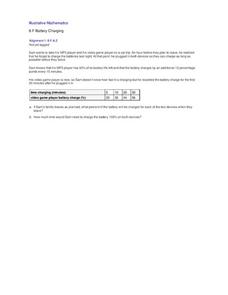
Battery Charging
Your class will be very interested in the results of this activity. How long does it take a MP3 and video game player to charge? Sam only has an hour and the MP3 player only has 40% of its battery life left. Plus, his video player...
Math Wire
Penguin Parade
Make way for the penguin parade! Based on a given pattern of penguins in an ascending number of rows, how many penguins were marching this year? Learners solve two word problems to find the answer.
Bowland
German or English?
Sprechen sie Deutsch? Future cryptographers must decide whether an unknown text is written in English or in German. They use provided pie charts about the frequency of words in the English and German languages to help make their decisions.
EngageNY
Finding One Hundred Percent Given Another Percent
Class members solve problems to find the whole when given a percent. They use double line numbers and factors of hundred to help break the 100 percent into equal segments.
West Contra Costa Unified School District
Graph Square Root and Cube Root Functions
Scholars first learn to graph square root and cube root functions by creating a table of values. They then learn how to graph functions from transformation of the graphs of the parent square root and cube root functions.
Curated OER
Reading Comprehension 1: Level 11
Here’s a reading comprehension assessment that will capture the interest of your learners. Stink bugs and the danger they pose to farmers is the subject of the passage, while the eight questions ask readers to infer, predict, summarize...
Illustrative Mathematics
Are These Right?
Is that a right triangle or a wrong triangle? Young mathematicians look at eleven different shapes and use a measuring tool of their choice to determine which triangles have right angles. Consider cutting out sets of the shapes to...
Mathed Up!
Scatter Graphs
Make an estimate by getting in line. The class works with scatter plots and lines of best fit to make an estimate for given values. Pupils determine whether there is a positive or negative correlation and draw a best-fit line. Using the...
