Math Moves U
Collecting and Working with Data
Add to your collection of math resources with this extensive series of data analysis worksheets. Whether your teaching how to use frequency tables and tally charts to collect and organize data, or introducing young...
EngageNY
Modeling from a Sequence
Building upon previous knowledge of sequences, collaborative pairs analyze sequences to determine the type and to make predictions of future terms. The exercises build through arithmetic and geometric sequences before introducing...
California Education Partners
T Shirts
Which deal is best? Learners determine which of two companies has the best deal for a particular number of shirts. They begin by creating a table and equations containing each company's pricing structure....
Illustrative Mathematics
Walk-a-thon 1
Your mathematician's job is to explore the relationship between hours and miles walked during a walk-a-thon. The activity compels your learners to experiment with different means in finding out this proportional relationship. The answer...
Illustrative Mathematics
Walk-a-thon 2
During a walk-a-thon your learners must determine the walking rate of Julianna's progress. Using tables, graphs, and an equation, they must be able to calculate the time it took her to walk one mile and predict her distance based on the...
EngageNY
Analyzing a Data Set
Through discussions and journaling, classmates determine methods to associate types of functions with data presented in a table. Small groups then work with examples and exercises to refine their methods and find functions that work...
Buffalo-Hanover Montrose Schools
Histogram Worksheet
Young mathematicians analyze a given set of numbers to complete a frequency table, and then make a histogram using the data. The worksheet includes three sets of data on the worksheet.
K5 Learning
Mixed Practice Word Problems #6
Nine questions make up a mixed practice worksheet. The word problems require scholars to show what they know about money, addition, subtraction, multiplication, and division using numbers up to 5,300.
Statistics Education Web
Saga of Survival (Using Data about Donner Party to Illustrate Descriptive Statistics)
What did gender have to do with the survival rates of the Donner Party? Using comparative box plots, classes compare the ages of the survivors and nonsurvivors. Using the same method, individuals make conclusions about the...
Mathematics Assessment Project
Sorting Functions
There's no sorting hat here. A high school assessment task prompts learners to analyze different types of functions. They investigate graphs, equations, tables, and verbal rules for four different functions.
EngageNY
Modeling Relationships with a Line
What linear equation will fit this data, and how close is it? Through discussion and partner work, young mathematicians learn the procedure to determine a regression line in order to make predictions from the data.
Mathematics Assessment Project
“Ponzi” Pyramid Schemes
Use mathematics to show your classes the power of a good model. Young mathematicians analyze the famous Ponzi pyramid scheme using an exponential pattern. They make conclusions on the reliability of the plan and why it is illegal.
Curated OER
Problem-Solving Application: Make a Circle Graph
In this circle graphs activity, students analyze a data table about the activities in a day. Students then use this data to make a circle graph. Students answer 6 questions about the graph.
Curated OER
Vocabulary Multiple Choice Worksheet 4
In this ESL vocabulary worksheet, learners read 10 sentences that have a missing word or phrase. From 4 choices of similar words, students select the best answer to make the sentence correct. This is intended for ESL learners but is...
Curated OER
Math Worksheet 1: Subtraction B
At first sight, younger mathematicians may be intimidated. Tell them not to worry because with a little practice they'll be able to subtract single digit numbers from double-digit numbers ending in 0 with ease. There are 16 problems...
Education Development Center
Creating a Polynomial Function to Fit a Table
Discover relationships between linear and nonlinear functions. Initially, a set of data seems linear, but upon further exploration, pupils realize the data can model an infinite number of functions. Scholars use multiple representations...
Attainment Company
Money Skills
Young mathematicians learn to make sense out of money with this collection of skills practice worksheets. From identifying the different coins and bills in the US currency system, to counting money and correctly using the dollar and...
Balanced Assessment
Scale Charts
Develop scales using tables. Pupils complete charts to show equivalent scale factors before using the completed tables to determine the sizes of scale drawings. They finish the lesson and demonstrate their understanding by completing a...
Wordpress
Introduction to Exponential Functions
This lesson begins with a review of linear functions and segues nicely over its fifteen examples and problems into a deep study of exponential functions. Linear and exponential growth are compared in an investment task. Data tables are...
Curated OER
Word Problem Practice Workbook
Need worksheets that challenge your middle schoolers to apply their understanding of math? Problem solved! From integers, fractions, and percents, to algebra, geometry, and probability, over 100 pages of word problem worksheets...
EngageNY
Interpreting Residuals from a Line
What does an animal's gestation period have to do with its longevity? Use residuals to determine the prediction errors based upon a least-square regression line. This second lesson on residuals shows how to use residuals to create a...
Curated OER
Sunshine Math 3
In this word problems instructional activity, learners read and problem solve nine mathematical word problems involving grids, measurement, compensation and angles.
National Council of Teachers of Mathematics
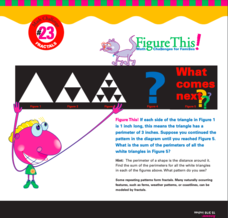
Math Challenge #23: Fractals
Young scholars explore the concepts of Sierpinski's triangle, ratios, and concentrations. For this exploratory lesson, students are given three problems to solve. Young scholars learn about Sierpinski's triangle, how to calculate mpg for...
Curated OER
M&M Science and Math
A series of math and science activities feature M&M's® as manipulatives to help kids work through equations. The resource includes exercises on finding averages, percent of compositions, moles in chemical reactions, genotypes and...


