Curated OER
Getting Started with Interactive Math Notebooks
Set young mathematicians up for success with this interactive math notebook. Including a list of rules and expectations for using the notebooks, as well as templates for a creating a cover page and table of contents, this resource...
K-5 Math Teaching Resources
Mini Math Word Wall
Provide a little extra support for your emerging mathematicians with a personal word wall. Including graphics and images that support children with learning to count, identify colors and shapes, and read high frequency words, this
Charleston School District
Solving Systems Graphically
When guess and check gets old, it's time to start graphing! An instructive lesson explains how to solve a system of linear equations using graphing. Equations are in both slope-intercepts and standard form.
Virginia Department of Education
Radical Equations
Provide learners with the skill for how to examine algebraic and graphical approaches to solving radical equations. Learners solve various radical equations involving square root and cube root expressions. They first solve using...
Willow Tree
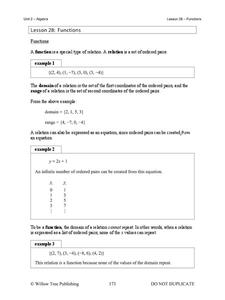
Functions
What makes a function a function? Learn the criteria for a relation defined as a function both numerically and graphically. Once young mathematicians define a function, they use function notation to evaluate it.
Charleston School District
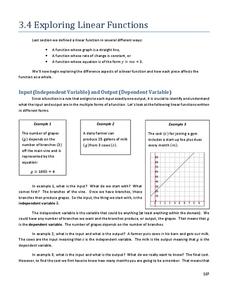
Exploring Linear Functions
What does a graph or equation say about a situation? Lots! The lesson uses the concepts explored in the previous four lessons in the series and applies them to problem solving situations. Learners create an equation from problems posed...
Chapman University
Graphs of the Sine and Cosine Function in Degrees
This bright, clear, graphic, display of the sin(x) and cos(x) functions spans the domain between -360 degrees and 360 degree. Use it as a poster, handout, presentation slide, or project it onto a whiteboard.
Chapman University
Graphs of the Sine and Cosine Function in Radians
This bright, clear, graphical display of the sin(x) and cos(x) functions spans the domain between -2 pi radians and 2 pi radians. Use it as a poster, handout, presentation slide, or project it onto a whiteboard.
Virginia Department of Education
Scientific Notation
Writing a number is all in the notation. The resource introduces the class to scientific notation. Pupils learn the process of taking a very large or small number in standard form and write it in scientific notation. To practice,...
Charleston School District
Solving Systems by Inspection
Can you solve a system by just looking at it? The previous lessons in the series taught three methods of solving systems of equations. Now learners discover they can determine the number of solutions of a system just by looking at it....
Virginia Department of Education
Quadratic Equations
Review the multiple methods of solving quadratic equations through an analysis of the discriminant. Scholars use the discriminant to determine the best solution method and then solve various equations. As a challenge, learners build...
Charleston School District
Identifying Irrational Numbers
These numbers have some personality! Are they rational or irrational? The lesson examines the definitions of rational and irrational numbers and shows examples of how to identify them.
Charleston School District
Transformation Basics
Transformations are more than the process in which sports cars become fighting robots. Listed in terms of which transformations give congruent or similar figures, several resources provide definitions and examples of the four basic...
Charleston School District
Increasing, Decreasing, Max, and Min
Roller coaster cars traveling along a graph create quite a story! The lesson analyzes both linear and non-linear graphs. Learners determine the intervals that a graph is increasing and/or decreasing and to locate maximum and/or minimum...
Charleston School District
Graphs of Linear Functions
What does a slope of 2/3 mean? Develop an understanding of the key features of a linear function. Pupils graph the linear functions and explain the meaning of the slope and intercepts of the graphs.
Charleston School District
Solving Equations by Combining Like Terms
How do you make these x's get along? Building on the previous lesson in the series, learners solve equations by combining like terms. The video uses objects to help pupils understand the concept.
Charleston School District
Solving Equations with Infinite or No Solutions
Where did all the variables go? Scholars learn how to interpret an equation when they eliminate all variables during the solving process. They interpret the solution as infinite solutions or no solutions.
Charleston School District
Solving Exponent Equations
Show your class that not all equations are linear. The lesson asks learners to solve simple quadratic and cubic equations using square and cube roots. Problems include equations with no solutions.
Charleston School District
3D Applications of the Pythagorean Theorem
How many right triangles can you find in a prism, cone, or pyramid? Using right triangles to find lengths in three-dimensional figures is the focus of the lesson. After working with the Pythagorean Theorem to find missing side lengths...
Willow Tree
Graphing
So many methods and so little time! The efficient method of graphing a linear equation depends on what information the problem gives. Pupils learn three different methods of graphing linear equations. They graph equations using...
Willow Tree
Order of Operations
It's the classic please excuse my dear aunt sally strategy to remembering the order of operations. Young mathematicians practice to develop an understanding of the order of operations. Examples and practice problems include absolute...
Willow Tree
Solving Quadratic Equations
Polynomials are full of solutions! Learners understand that the degree determines the number of solutions. Examples show quadratic equations solved by factoring and by using the quadratic formula. A cubic equation is even mixed in for...
Willow Tree
Angle Measurement
What do you create when you rotate a ray? An angle! Teach all the angle basics including naming, measuring, supplements, and complements.
Willow Tree
Transformations
How does something go from here to there? Describe it with a transformation. Young mathematicians learn how to translate, reflect, rotate, and dilate an image.


