EngageNY
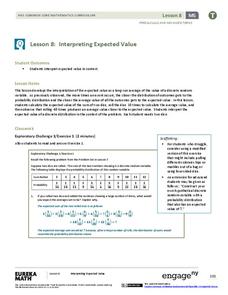
Interpreting Expected Value
Investigate expected value as a long-run average. The eighth installment of a 21-part module has scholars rolling pairs of dice to determine the average sum. They find aggregate data by working in groups and interpret expected value as...
American Statistical Association
The Taste of Yellow
Does lemonade taste better when yellow? A tasty experiment has scholars determine the answer to the question. It requires conducting a taste test with lemonades of different colors (from food coloring), and then collecting and analyzing...
American Statistical Association
Spinners at the School Carnival (Equal Sections)
Spin to win a toy car. A fun activity has pupils use a spinner in which three of the equal sections represent winning a toy car, and the fourth section represents no car. They record the number of wins after certain numbers of spins,...
National Institute of Environmental Health Sciences
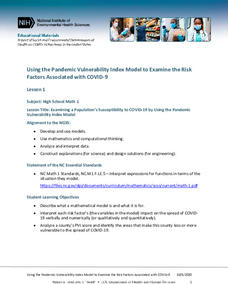
Lesson 1: Using the Pandemic Vulnerability Index Model to Examine the Risk Factors Associated with COVID-19
How vulnerable are you to COVID-19? High school mathematicians use the Pandemic Vulnerability Index to create models that help them collect and analyze data about the risk factors associated with COVID-19. After investigating four groups...
Curated OER
Looking at Data
Third graders use two days to create, collect, display and analyze data. Classroom activities and practice build greater understanding to a variety of forms used to display data.
Curated OER
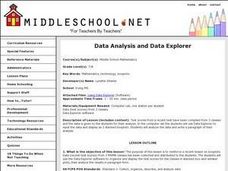
Data Analysis and Data Explorer
Students use the Data Explorer software to organize and display the test scores for the classes in stacked box-and-whisker plots, then analyze the results in paragraph form.
Curated OER
Explore: Collect And Organize Data
In this exploring how to collect and organize data worksheet, students, working with a partner, problem solve the answers to seven word problems involving data.
Curated OER
Investigating: Interpreting Graphs and Analyzing Data
Students explore statistics by researching class birthday data. In this data analysis lesson plan, students investigate the different birthdays among their classmates and create data tables based on the given information. Students view...
Curated OER
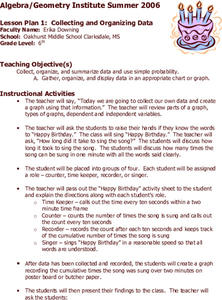
Collecting and Organizing Data
Sixth graders practice collecting and organizing data. In groups, 6th graders determine how many times "Happy Birthday" (at a reasonable rate) may be sung in ten seconds. They collect the information and create a graph.
Curated OER
Data Analysis
Students examine techniques to represent data. In this data analysis lesson, students read about various ways to represent data, such as a stem and leaf diagram and calculating standard deviation. Students complete data analysis...
Curated OER
Favorite Apple Graph
First graders record their favorite type of apple in the form of a graph. They each try one slice of a Red Delicious, Golden Delicious, and Granny Smith apple, select their favorite type, and create a class graph using the data collected.
Curated OER
Collecting And Fitting Quadratic Data
Pupils investigate the concept of using quadratic data to plot coordinates on a plane. They also apply the quadratic formula for a variety of problems with the help of a graphing calculator to draw the parabola for given coordinates.
Curated OER
Sweethearts and Data Analysis
Students explore the concept collecting and representing data. In this collecting and representing data instructional activity, students record the different colors of sweetheart candies in their sweethearts box. Students create a table...
Curated OER
Create a Survey and Analyze the Data
Eighth graders create their survey discussing wording used in surveys and try to create one that is unbiased. They distribute the survey to the middle school but not during instructional time. They then collect and analyze the data...
Curated OER
Spaghetti Graphs
Students work in pairs to test the strength of spaghetti strands. They collect and graph data to determine a line of best fit. Students create a linear equation to interpret their data. Based on the data collected, students predict...
Curated OER
Math Lesson: What Do You Want to Know? - Country Statistics
Students are able to identify the characteristics of a variety of graphs (i.e. bar graph, line graph, pie graph, scatter plot, population pyramids, etc.) They recognize how the type of data to be presented plays a role in choosing the...
Curated OER
Name That Tune: Matching Musical Tones Through Waveform Analysis
Pupils detect the waveform of musical notes to determine the code for the "safe" in this forensics simulation lesson. They use a microphone and tuning forks along with Vernier EasyData on their graphing calculator to analyze five musical...
Discovery Education
Sonar & Echolocation
A well-designed, comprehensive, and attractive slide show supports direct instruction on how sonar and echolocation work. Contained within the slides are links to interactive websites and instructions for using apps on a mobile device to...
Curated OER
Bar Graphs With Intervals
Give your math class a comprehensive understanding of bar graphs with this series of lessons. The resource is divided into three parts, and all of the accompanying worksheets are included. The class will study different bar graphs,...
Curated OER
Murder in the First Degree - The Death of Mr. Spud
Secondary learners investigate exponential functions in a real-world scenario. They collect data on the temperature of a cooling baked potato, enter the data into lists, and graph the data using a scatter plot before finding an...
Curated OER
Statistical Analysis of Data by Gender
Students examine and identify gender bias, stereotyping, and discrimination in school materials, activities, and classroom instruction. They apply descriptive statistics knowledge to real-world data.
Curated OER
Pen Pals
Students collect bird count data at their sites, and share and compare the data collected from two different schoolyards using computer technology.
Curated OER
Linear Regression and Correlation
Learners explore scatter plots. In this linear regression lesson, groups of pupils graph scatter plots and then find the line of best fit. They identify outliers and explain the correlation. Each group summarizes and shares their...
Curated OER
Handling Data: Coin Tossing Simulation
Students collect experimental data and record it on a frequency table. After accessing an Internet coin toss simulation site they discover that repetition of an experiment may result in different outcomes. They identify the mutually...
