Radford University
A Change in the Weather
Explore the power of mathematics through this two-week statistics unit. Pupils learn about several climate-related issues and complete surveys that communicate their perceptions. They graph both univariate and bivariate data and use...
Mathematics Vision Project
Congruence, Construction and Proof
Learn about constructing figures, proofs, and transformations. The seventh unit in a course of nine makes the connections between geometric constructions, congruence, and proofs. Scholars learn to construct special quadrilaterals,...
Curated OER
Stone Soup
Students examine the topics of conflict, resolution, and solution using the book "Stone Soup." They create a class pictograph using real vegetables brought in by the students, answer story comprehension questions, and sequence the events...
Curated OER
Data Analysis and Froot Loops
Use this probability and graphing instructional activity to have your learners work with a partner to make a necklace out of Froot Loops. They record the cereal colors randomly chosen and strung, graph their data, then use a ratio...
Curated OER
Loan Amortization - Mortgage
Upper graders explore the connection between interest and principal. They use an amortization schedule to determine the amount of principal paid vs interest on a $100,000 home loan. Fourteen discussion questions and a research-based...
Curated OER
Buying on Credit
Explore using credit in this financial responsibility and math lesson. Learn to identify the acronym of "PRT" as Principle x Rate x Time, then calculate interest based on this formula. Do some real-world problem solving and choose...
Curated OER
Multiplying Larger Numbers by Ones
Those are some big numbers! Scholars multiply three and four-digit numbers by one-digit numbers in these equations. There are 28 total, and they do need to regroup for many of them. The one-digit numbers are all either 7, 8, or 9; use...
DK Publishing
Times Tables for Division #2
Use time tables to solve division problems - and vice versa. Third graders work on 60 division drills with multiples of 2, 3, 4, 5, and 20. These problems reinforce your class's knowledge of both times tables and division problems,...
Illustrative Mathematics
Art Class, Assessment Variation
Play with paint and decide the ratio to make different shades of green. When mixing paint colors, your painters should decide which ratios make the same shade and what is needed to mix other ratios for a different shade of green. This is...
Beacon Learning Center
Spotted Stones Linked Just Right
Discover how to play the game of dominoes using mental math skills to solve equations that earn points. Pupils become fast critical thinkers in determining which unknown addend tally up points in their favor.
Curated OER
Balanced Equations
Help your math class understand variables. This activity is for a visual learner. They will use weights and a balance scale to show how the sides of an equation are equal. Worksheet is included.
Willow Tree
Bar Graphs
Circles, lines, dots, boxes: graphs come in all shapes in sizes. Scholars learn how to make a bar graph using univariate data. They also analyze data using those bar graphs.
EngageNY
Why Call It Tangent?
Discover the relationship between tangent lines and the tangent function. Class members develop the idea of the tangent function using the unit circle. They create tables of values and explore the domain, range, and end behavior of...
EngageNY
Basic Trigonometric Identities from Graphs
Have young mathematicians create new identities! They explore the even/odd, cofunction, and periodicity identities through an analysis of tables and graph. Next, learners discover the relationships while strengthening their...
EngageNY
Linear and Exponential Models—Comparing Growth Rates
Does a linear or exponential model fit the data better? Guide your class through an exploration to answer this question. Pupils create an exponential and linear model for a data set and draw conclusions, based on predictions and the...
California Education Partners
Summer Olympics
Quickly get to the decimal point. The last assessment in a nine-part series requires scholars to work with decimals. Pupils compare the race times of several athletes and calculate how much they have improved over time. During the second...
Curated OER
Range, Cluster, Gap and Outliers
There are a number of activities here where learners collect and record data, as well as, activities where the likelihood of an event happening is calculated given the experimental probability. Young statisticians organize information...
Illustrative Mathematics
Shake and Spill
Entertaining as well as educational, this math activity about decomposing numbers is bound to capture the engagement of young learners. Given a cup and five two-color counters, young mathematicians simply shake and spill the cup,...
Achieve
Greenhouse Management
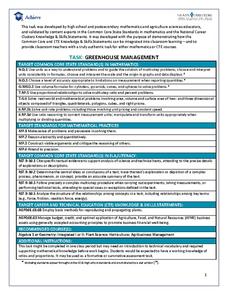
Who knew running a greenhouse required so much math? Amaze future mathematicians and farmers with the amount of unit conversions, ratio and proportional reasoning, and geometric applications involved by having them complete the...
Curated OER
Tiles, Blocks, Sapphires & Gold: Designing a Treasure Map
Young cartographers in groups hide treasure at school and then create a map to find it using pattern blocks and tiles. They make paintings with clues to create a visual representation of the location of their treasure. Groups present...
Curated OER
Comparing Investments
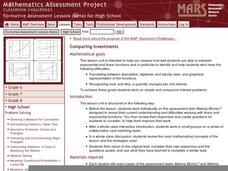
Money, money, money. A complete lesson that makes use of different representations of simple and compound interest, including written scenarios, tables, graphs, and equations to highlight similarities and differences between linear and...
SHS Algebra
Linear vs. Exponential Functions Tasks
Your algebra learners will enjoy the real-life application of the three tasks presented here. They complete a table and a graph comparing the two options presented. One option is linear, while the other is exponential. After coming up...
101 Questions
Super Stairs
Keep your classes climbing in the right direction. Young mathematicians collect data from a video presentation. Using their data, they build an arithmetic sequence and use it to make predictions.
Curated OER
Sort It Out
Elementary schoolers engage in a game of logical reasoning called Secret Sort. A Venn diagram is used as a way to sort objects. This resource would be a great way to introduce the Venn diagram (maybe the most famous, and most-useful...

