Agriculture in the Classroom
A Holiday Tradition: Which Christmas Tree Will You Choose?
Different varieties of Christmas trees provide an interesting way to combine social studies, science, math, and technology. Class members not only research the history of the Christmas tree holiday tradition, they compare and...
CoreCommonStandards.com
Common Core State Standards: Second Grade Workbook
You've hit the second grade Common Core jackpot! Find over 40 pages of curriculum designed specifically for the standards, both math and language arts. Printable versions of each standard can be used as learning displays, and...
Curated OER
The Polar Bear Game
In this statistics worksheet, learners answer questions about the probability of an even occurring using dices. They keep tract of their data using a table and analyze the data to make predictions. There are 12 questions with no...
Curated OER
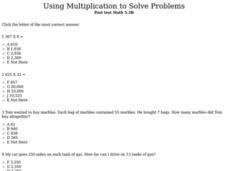
Using Multiplication to Solve Problems
In this interactive multiplication worksheet, students solve ten various problems by using multiplication skills. There are ten multiple choice problems to complete.
Curated OER
Color Me Large or Small Worksheet
Before handing out this number-value activity make sure you explain all directions clearly, as they may throw some students for a loop! Using starting numbers in a table, they first shade in all boxes with numbers smaller than that...
Noyce Foundation
Time to Get Clean
It's assessment time! Determine your young mathematicians' understanding of elapsed time with this brief, five-question quiz.
Inside Mathematics
Graphs (2004)
Show your pupils that perimeter is linear and area is quadratic in nature with a short assessment task that requests learners to connect the graph and equation to a description about perimeter or area. Scholars then provide a...
Curated OER
Bouncy Ball Collections
In this data table worksheet, students examine a table regarding bouncy ball data and respond to 4 questions regarding the data.
Inside Mathematics
Vencent's Graphs
I like algebra, but graphing is where I draw the line! Worksheet includes three multiple-part questions on interpreting and drawing line graphs. It focuses on the abstract where neither axis has numbers written in, though both are...
Noyce Foundation
Photographs
Scaling needs to be picture perfect. Pupils use proportional reasoning to find the missing dimension of a photo. Class members determine the sizes of paper needed for two configurations of pictures in the short assessment task.
Curated OER
Rates of Speed for Animals
In this rates of speed for animals worksheet, 5th graders use the data in the table to solve five word problems about how fast some animals can travel.
Curated OER
Problem Solving: Estimate or Exact?
In this number sense worksheet, 5th graders solve 6 word problems and explain why the answer makes sense. They use either estimated numbers or exact numbers as they solve the problems.
Curated OER
How do the scores compare?
In this comparison worksheet, students solve comparison problems based on a table of team scores. Students complete 7 problems.
Curated OER
Data Analysis
In this data analysis worksheet, 8th graders solve and complete 4 different problems that include determining the line of best fit for each. First, they write the prediction for an equation for each situation described. Then, students...
Curated OER
Finding Patterns in Pyramids and Prisms
In this finding patterns in pyramids and prisms worksheet, 4th graders use two tables showing faces, edges and vertices for pyramids and prisms to answer six questions about the patterns.
Virginia Department of Education
Matching Representations
Pupils explore the many representations of linear functions by completing a matching activity to connect the multiple representations of a function. They then reinforce the connection as individuals create the different representations...
Virginia Department of Education
Linear Modeling
An inquiry-based algebra lesson plan explores real-world applications of linear functions. Scholars investigate four different situations that can be modeled by linear functions, identifying the rate of change, as well as the...
Curated OER
Median and Mode
In this median/mode worksheet, students solve 6 problems, using a table of students and their heights in centimeters. Students find median, mode, outliers and arrange data from least to greatest.
EngageNY
Comparison Shopping—Unit Price and Related Measurement Conversions II
Which rate is greater and by how much? Pupils continue to compare rates to solve problems in the 20th portion of a 29-part series. Rates are presented in a variety of representations either using the same representation or different...
Curated OER
Patterns Relationship
In this patterns worksheet, students answer multiple choice questions about patterns containing one to four digit numbers. Students complete 10 multiple choice questions.
Curated OER
Family Activity: Bar Graphs and Line Graphs
In this math worksheet, students work at home with a family member on a graphing activity. Students count the number of cans, glass jars, boxes and bags in the pantry. Students make a bar and a line graph to represent the data.
Inside Mathematics
Graphs (2006)
When told to describe a line, do your pupils list its color, length, and which side is high or low? Use a worksheet that engages scholars to properly label line graphs. It then requests two applied reasoning answers.
Inside Mathematics
Population
Population density, it is not all that it is plotted to be. Pupils analyze a scatter plot of population versus area for some of the states in the US. The class members respond to eight questions about the graph, specific points and...
Curated OER
Integers and Functions
In this integers and functions worksheet, students solve 6 word problems involving function tables and writing equations to match the story.


