Curated OER
Learning to Make Line Graphs
Students analyze data and create a line graph. In this graphing lesson, students explore data from a previous experiment and plot the information on a line graph. Students analyze their findings.
Curated OER
Hurricanes As Heat Engines
Students examine sea surface temperatures to see how hurricanes get heat from the oceans surface. For this hurricanes lesson students use the Internet to find data and make line plots.
Curated OER
Making a Line Graph
In this line graph worksheet, learners use data given in a table and assign axes, make a scale, plot data and make a line or curve on their constructed graphs.
Curated OER
Olympic Line Graphs
Sixth graders examine how to make line graphs. In this Olympic line graph lesson students make line graphs and search the given Internet sites to find data on their summer Olympic Game.
NASA
Analyzing Surface Air Temperatures by Latitude: Student Activity
Explore global temperatures from the comfort of your learning place! Meteorologists analyze surface temperatures and anomalies across different latitudes. Investigators evaluate graphs to find temperature differences and answer questions...
Beyond Benign
Water Bottle Unit
How much plastic do manufacturers use to create water bottles each year? The class explores the number of water bottles used throughout the years to determine how many consumers will use in the future. Class members compare different...
Science Matters
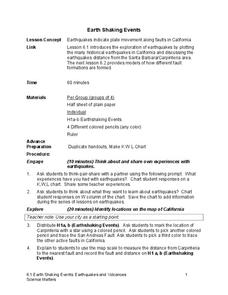
Earth Shaking Events
The world's largest measured earthquake happened in 1960 in Chile, reaching a terrifying 9.5 magnitude on the Richter Scale. The second lesson in the 20-part series introduces earthquakes and fault lines. Scholars map where previous...
California Academy of Science
California's Climate
The United States is a large country with many different climates. Graph and analyze temperature and rainfall data for Sacramento and Washington DC as you teach your class about the characteristics of Mediterranean climates. Discuss the...
Curated OER
Shake It Up with Scatterplots
Learners identify how to use a scatterplot to compare two sets of data to determine if they are related. Then they identify and describe the definition of regression line (the "line of best fit"). Students also identify how scientists...
Curated OER
Contour Basics: JAVA Mac/PC
Students explore how to draw contour lines from limited data and extend this knowledge to real data sets. They participate in many opportunities from students to assess their own progress and the exercise is completely online.
Curated OER
How's The Weather?
Students make a box and whiskers plot using the TI-73 graphing calculator. Each student would have their own calculator but they would work in small groups of two or three to help each other enter the data and make the plots.
Cornell University
Constructing and Visualizing Topographic Profiles
Militaries throughout history have used topography information to plan strategies, yet many pupils today don't understand it. Scholars use Legos and a contour gauge to understand how to construct and visualize topographic profiles. This...
Curated OER
Go The Distance Car Construction
Students build and program a car to drive a specific challenge distance.They must at the end of the lesson, have the car that stops the closest to a challenge distance.
Beyond Benign
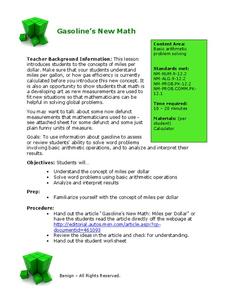
Got Gas
How much gas does it take to drive around town? The class uses a variety of mathematical procedures to take a look at the use of gas for transportation. Class members use a different unit to determine the cost of driving a car as opposed...
Curated OER
Depth Line
Students use adding machine tape to plot increasing ocean depths and deep sea historical events.
Curated OER
Is there Treasure in Trash?
More people, more garbage! Young environmentalists graph population growth against the amount of garbage generated per year and find a linear model that best fits the data. This is an older resource that could benefit from more recent...
Curated OER
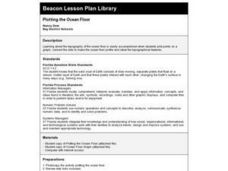
Plotting the Ocean Floor
Fourth graders plot points on a graph, connect the dots to make the ocean floor profile and label the topographical features. They utilize a worksheet and a website imbedded in this plan to plot the ocean floor.
Curated OER
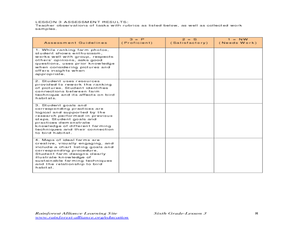
How can my breakfast help the birds?
Sixth graders design farms with a bird's habitat in mind. In this farm lesson plan, 6th graders research how sun grown coffee destroys a bird habitat, and then they make their own farm with a bird's habitat being preserved. They then...
Curated OER
The Spectrum of a Star
Tenth graders identify stars based on their line spectra. In this astronomy lesson, 10th graders analyze spectrograph and determine the elements present in the star. They explain the relationship between temperature and star classes.
Curated OER
Creeping
Students observe, measure, and graph a model of slow down slope movement representing soil creep. This task assesses students' abilities to collect, record, and organize data, set up graph axes, plot data points, draw line graphs, apply...
Curated OER
Bungee Jump Lab
Student apply linear relationships to the real world. They use Ken and Barbie dolls and experiment to find the line of best fit. They collect data, analyze data, and make predictions from it. The young scholars also use Microsoft Power...
Curated OER
Physics: Visualization of Hydrogen Wave Functions
Students explore various methods for visualizing the results of hydrogen wave function. They observe trends using a polar plot tool and make plots for the first three energy levels of the radial wave function for hydrogen. Students apply...
Curated OER
Hey, Look Me Over!
Students make observations about mealworms using hand lenses, rulers, and cotton swabs. Students complete their own mealworm observation chart, then they share their observations with the class. This is one station out of five in an...
Curated OER
The Big Bang-Hubble's Law
In this Hubble's law instructional activity, students use data for galaxies which include their distance and speed. Students make a graph to show the distance to each galaxy and the speed of each galaxy. They use their graph to answer 4...


