Virginia Department of Education
Numbers in a Name
What's in a name? Pupils create a data set from the number of letters in the names of classmates. Each group then takes the data and creates a visual representation, such as a histogram, circle graph, stem-and-leaf plot, etc.
American Statistical Association
Spinners at the School Carnival (Equal Sections)
Spin to win a toy car. A fun activity has pupils use a spinner in which three of the equal sections represent winning a toy car, and the fourth section represents no car. They record the number of wins after certain numbers of spins,...
American Statistical Association
Spinners at the School Carnival (Unequal Sections)
Everyone's a winner. Scholars analyze a spinner with five unequal sections, three of which represent winning a toy car and the other two represent winning a toy truck. They conduct an experiment to estimate the number of toy cars and...
Curated OER
Probability Games and Activities, Unit 10
Looking for tangible ways to practice probability with your class? Through 4 activities, students practice with experimental probability, using math to make educated guesses, then testing it through physically completing the experiment....
Curated OER
ou are the Researcher!
Students conduct a census at school. They collect data, tally it, and create a frequency table. Students display their data in three different types of graphs. They write complete sentences describing the graph.
Curated OER
Handling Data: Coin Tossing Simulation
Students collect experimental data and record it on a frequency table. After accessing an Internet coin toss simulation site they discover that repetition of an experiment may result in different outcomes. They identify the mutually...
Curated OER
Atlatl Lessons Grades 4-12: Lesson for Beginning Users of Atlatl
Sixth graders determine the mean, range median and mode of a set of numbers and display them. In this data lesson plan students form a set of data and use computer spreadsheet to display the information. They extend of the process by...
Curated OER
Integrated Algebra Practice: Histograms
In this histogram worksheet, students solve 6 multiple choice and short answer problems. Students read histograms and determine the frequency of a particular item.
Curated OER
Are Taxes "Normal?"
Students explore the concept of normal distribution. In this normal distribution lesson, students find the normal distribution of taxes in the 50 US states. Students make histograms, frequency tables, and find the mean and median of tax...
Curated OER
Tony's Spelling Troubles
Students are introduced to the given problem and describe in their own words the situation represented in a bar chart and tally chart. They then use a bar chart and tally chart to make sensible predictions.
Pennsylvania Department of Education
Volume and Surface Area
Build boxes using unit cubes to compare surface area and volume. The group performs multiple experiments to determine properties of volume, such as if it makes a difference which order the dimensions are multiplied in. Extensive...
Curated OER
Showing Favorites
In this tally chart activity, students use the tally chart on the page to answer 2 questions. They then solve the last 2 questions using their own tally chart.
Curated OER
Ice Cream Scoop
In this data display worksheet, students write 6 flavors of ice cream on pieces of paper. Students choose papers one at a time and keep track on a tally sheet. Students make a bar graph of the results.
Curated OER
Matrices and Vectors
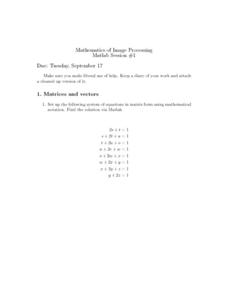
In this matrices and vectors worksheet, learners solve 9 various types of problems related to forming matrices and vectors. First, they set up each system of equations listed in matrix form using mathematical notation. Then, students...
Curated OER
Data and charts
In this data and charts worksheet, students answer multiple choice questions referring to different charts about mountain heights, breakfast drinks, and more. Students complete 10 multiple choice questions.
Curated OER
High Five Board Game
For this high five board game worksheet, 8th graders use the game board and instructions provided to create ordered pairs using dice and cubes, then analyze the probability and predict outcomes.
Mathed Up!
Stratified Sampling
Young mathematicians learn how to solve problems involving stratified sampling. They review concepts of sampling and proportionality by watching a video and then they complete a activity of questions on this topic.
Curated OER
All in the Family
Students use data to make a tally chart and a line plot. They find the maximum, minimum, range, median, and mode of the data. Following the video portion of the lesson, students will visit a Web site to test their data collection skills...
Curated OER
Skittles, Taste the Rainbow
Fifth graders learn and then demonstrate their knowledge of a bar and a circle graph using the classroom data. Students are given a pack of skittles candy. Students create a bar and circle graph indicating the results of the contents of...
Curated OER
Code Breakers
Learners collect data and make a frequency table, change ratios into percents, and analyze data to make predictions.
Curated OER
ng Data: Probability, What's in the bag?
Young scholars use the language associated with probability to discuss events including those with equally likely outcome. They collect data from a simple experiment and record in a frequency table: estimate probabilities based on this...
Curated OER
Data Analysis and Probability
Students make their own puzzle grid that illustrates the number of sit-ups students in a gym class did in one minute, then they make a histogram for this same data. Then they title their graph and label the scales and axes and graph the...
Curated OER
What's Your Favorite Planet?
Fourth graders, after listing the nine planets and their differences, choose one planet as their favorite. From the information acquired on each students favorite planet, they make a graph illustrating their favorites and then transform...
Utah Education Network (UEN)
Probability and Statistics
MAD about statistics? In the seventh chapter of an eight-part seventh-grade workbook series, learners develop probability models and use statistics to draw inferences. In addition, learners play games and conduct experiments to determine...


