Space Awareness
Let's Map the Earth
Before maps went mobile, people actually had to learn how to read maps. Pupils look at map elements in order to understand how to read them and locate specific locations. Finally, young cartographers discover how to make aerial maps.
DiscoverE
LIDAR: Mapping with Lasers
We would be lost without maps! How are they made? Introduce junior topographers to LIDAR technology with a fascinating activity. Set up a mock city, then have learners operate a laser measure to determine the shape of the landscape using...
NASA
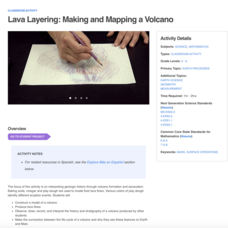
Lava Layering: Making and Mapping a Volcano
Looking for an out-of-this-world volcanic activity? Geologists study Earth's volcanic history and the neighboring planet Mars by modeling volcanic eruptions, lava flows, and building a shield volcano. Participants use graph paper and...
Artisan Global
QuakeFeed Earthquake Map, Alerts and News
Amateur seismologists explore Earth's earthquakes in real time using a variety of map styles and parameter selections.
Teach Engineering
Using Map Scales to Figure Distances and Areas
The asteroid is getting closer and the question is whether the state of Alabraska is large enough for the shelter calculated in the previous activity. Teams determine the scale of their project and then use the scale on the map to...
NOAA
Wet Maps
How do oceanographers make maps under water? Junior explorers discover the technologies and processes involved in creating bathymetric maps in part three of a five-part series designed for fifth- and sixth-grade pupils. The...
National Science Teachers Association
Using Concept Maps in the Science Classroom
A good concept map requires high thought processes. This makes it a great tool for teaching and evaluating your pupils. A helpful article describes a great approach for teaching young scholars the art of concept map building and how best...
NOAA
Mapping the Deep-Ocean Floor
How do you create a map of the ocean floor without getting wet? Middle school oceanographers discover the process of bathymetric mapping in the third installment in a five-part series of lessons designed for seventh and eighth graders....
ReadWriteThink
Concept Map
When you think of one topic, related ideas and details invariably follow. That's concept mapping! Jot down ideas with a straightforward graphic organizer that works both electronically and as a printed resource.
Curated OER
Weather Maps and Prediction
Young meteorologists read basic weather maps by learning about the symbols that are associated with them. This two-day lesson has some excellent demonstrations and activities to get youngsters thinking about the weather in scientific...
Curated OER
Creating a Thematic Map
Students create and analyze a weather-related data table and a thematic map based upon information provided.
Curated OER
Exploring Biomes Lesson 1: Mapping Biomes
Environmental science learners examine satellite imagery of temperature, vegetation, precipitation, and productivity. They use these maps to understand how scientists divide the planet into major biomes. As part of a larger unit on...
Curated OER
Mapping the Aegean Seafloor
Earth science learners create a two-dimensional topographic map of the floor of the Aegean Sea. They use it to then create a three-dimensional model of the ocean floor features. This comprehensive resource delivers strong background...
PBS
Map a Model Solar System
Creating a solar system map is a snap thanks to a hands-on activity! Science scholars explore the solar system by building it wherever they choose during an interactive from PBS's Space series. Users pick both the location and scale for...
Biology Junction
Cell Reproduction Concept Map
For this cell reproduction worksheet, scholars complete a concept map using different vocabulary words that describe the different phases a cell goes through in the reproduction process.
Curated OER
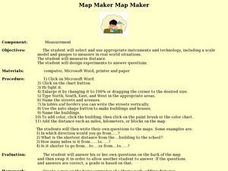
Map Maker, Map Maker
Map maker, map maker, make me a map! Your class can sing this tune as they work to create their own regional maps by taping paper to the wall, projecting an overhead transparency image, and tracing. Where this lesson plan intends for the...
Curated OER
Unit III: Worksheet 2 - Motion Maps
Make motion maps, draw graphical representations, and determine displacement. These are the activities included in this physics assignment. This is a great review of velocity, position, acceleration, and displacement concepts.
Howard Hughes Medical Institute
Gorongosa: Making Observations Activity
Do you have young scientists wanting to make new discoveries rather than just completing the same experiments? Young scientists use their observational skills to identify animals and patterns in animal behavior. Through tracking...
Teach Engineering
Where Are the Plastics Near Me? (Mapping the Data)
The last activity in a nine-part series has teams create a Google Earth map using the data they collected during a field trip. Using the map, groups analyze the results and make adjustments to the map to reflect their analysis. A short...
National Geographic
Mapping the Shape of Everest
With Mount Everest as the motivator, your earth science class learns about topographic maps. Begin by showing a film clip from The Wildest Dream: Conquest of Everest, featuring fearsome virtual imagery of a path up world's tallest...
Curated OER
Grid Frame Mapping
Students map and describe small area of the schoolyard and discuss habitats.
Curated OER
Exploring Biomes Lesson 4: Mapping Arizona
Once junior ecologists are familiar with Earth's major biomes, they hone in on Arizona's biomes. Using a website about Arizona's natural resources, learners will identify biotic communities. Beautiful maps and worksheets are provided for...
Curated OER
Exploring Arizona's Biotic Communities Lesson 1: Mapping Biotic Communities
As part of a unit on Arizona's biotic communities, young ecology learners create a map. They describe how humans and animals adapt in their habitat. They take notes and create graphic organizers from articles they read. Beautiful maps,...
Curated OER
Unit II: Worksheet 5 - Velocity and Motion Maps
A chart with eight rows makes up this handout. The columns are labeled with two graphs ("x vs. t" and "v vs. t"), a written description, and a motion map. One cell in each row is filled in, leaving the rest for your class to complete....
Other popular searches
- Making Maps Geography
- Making Maps and Research
- Making Maps Using Technology
- Making Maps of History
- China, Making Maps
- Making Maps of Community
- Reading Making Maps
- Neigborhoods and Making Maps
- Making Maps Lesson Plans
- Making Map Scales
- Making Maps Usign Technology
- Making a Map Project


