EngageNY
Relationships Between Two Numerical Variables
Is there another way to view whether the data is linear or not? Class members work alone and in pairs to create scatter plots in order to determine whether there is a linear pattern or not. The exit ticket provides a quick way to...
Curated OER
Equal Differences Over Equal Intervals 2
Your algebra learners explore linear functions concretely using tables of values in a collaborative task. The idea that linear function values change by equal differences over equal intervals, is emphasized. The slope and...
Curated OER
Equal Differences Over Equal Intervals 1
Learners explore linear functions concretely using tables of values in a cooperative task. The concept of the values of linear functions changing by equal differences over equal intervals of one is emphasized. Learners will discover...
Noyce Foundation
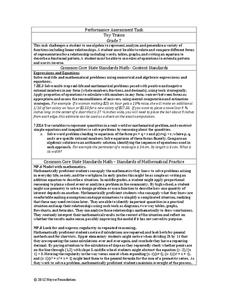
Toy Trains
Scholars identify and continue the numerical pattern for the number of wheels on a train. Using the established pattern and its inverse, they determine whether a number of wheels is possible. Pupils finish...
Inside Mathematics
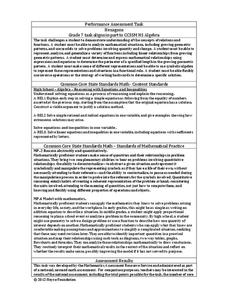
Hexagons
Scholars find a pattern from a geometric sequence and write the formula for extending it. The worksheet includes a table to complete plus four analysis questions. It concludes with instructional implications for the teacher.
Inside Mathematics
Graphs (2007)
Challenge the class to utilize their knowledge of linear and quadratic functions to determine the intersection of the parent quadratic graph and linear proportional graphs. Using the pattern for the solutions, individuals develop a...
Concord Consortium
Functions by the Slice
Piece by piece ... dismantling a function can highlight interesting patterns. The task asks learners to slice functions in sections with the same vertical change. They then recreate the graph with these slices positioned horizontally....
Curated OER
Hand Span and Height
Is there a relationship between hand span width and height? Statisticians survey each other by taking measurements of both. A table that can hold data for 24 individuals is printed onto the worksheet, along with questions for analysis....
Concord Consortium
Systematic Solution I
Writing a general rule to model a specific pattern is a high-level skill. Your classes practice the important skill as they write rules describing the solutions to a system of equations with variable coefficients. As an added challenge,...
Bowland
Patchwork Cushions
Find out if there are enough squares. Given diagrams for the first four figures in a sequence, pupils try to determine the next figure. Individuals find the number of square and triangle pieces of fabric that are required to make...
Concord Consortium
Graphical Depictions
Parent functions and their combinations create unique graphical designs. Learners explore these relationships with a progressive approach. Beginning with linear equations and inequalities and progressing to more complex functions,...
Inside Mathematics
Conference Tables
Pupils analyze a pattern of conference tables to determine the number of tables needed and the number of people that can be seated for a given size. Individuals develop general formulas for the two growing number patterns and...
Inside Mathematics
Graphs (2004)
Show your pupils that perimeter is linear and area is quadratic in nature with a short assessment task that requests learners to connect the graph and equation to a description about perimeter or area. Scholars then provide a...
CCSS Math Activities
Patchwork
Patch up any misconceptions about writing functions. Scholars undertake a performance task that has them first examine a pattern in patchwork cushions. They represent the patterns in triangular and rectangular blocks using a table and as...
CCSS Math Activities
Smarter Balanced Sample Items: 8th Grade Math – Target J
Look at patterns in bivariate data. Eight sample items illustrate the eighth grade statistics and probability standards. The Smarter Balanced Sample multiple-choice items focus on numerical and categorical bivariate data. The slide show...
Mathed Up!
Straight Line Graphs
Develop graphs by following the pattern. The resource provides opportunities for reviewing graphing linear equations. Pupils create tables to graph linear equations by using patterns whenever possible. The learning exercise and video are...
Mathematics Assessment Project
Shelves
Don't leave this task on the shelf — use it is assess middle schoolers understanding of patterns. Participants try to discover a pattern in the number of bricks and planks used to make shelves. They then match descriptions...
Illustrative Mathematics
Kitchen Floor Tiles
An interesting way to look at the kitchen floor is to count the number of tiles in the border. Fred starts with four white floor tiles and writes an expression for the number of tiles needed for the colored border. Algebra learners are...
Mathematics Assessment Project
Cross Totals
Finally, it all adds up. Learners complete a number puzzle in which they investigate the sums of the digits one through nine in a cross pattern. They then try to determine what totals are possible and which ones are...
Concord Consortium
Intersections II
How many intersections can two absolute value functions have? Young scholars consider the question and then develop a set of rules that describe the number of solutions a given system will have. Using the parent function and the standard...
EngageNY
Analyzing Residuals (Part 1)
Just how far off is the least squares line? Using a graphing calculator, individuals or pairs create residual plots in order to determine how well a best fit line models data. Three examples walk through the calculator procedure of...
EngageNY
Analyzing a Data Set
Through discussions and journaling, classmates determine methods to associate types of functions with data presented in a table. Small groups then work with examples and exercises to refine their methods and find functions that work...
Curated OER
8.SP.1Texting and Grades I
Here is a fitting question for middle schoolers to consider: Is there a relationship between grade point average and frequency of sending texts? Starting statisticians examine a scatter plot and discuss any patterns seen.
EngageNY
Analyzing Residuals (Part 2)
Learn about patterns in residual plots with an informative math lesson. Two examples make connections between the appearance of a residual plot and whether a linear model is the best model apparent. The problem set and exit ticket...
Other popular searches
- Linear Patterns Word Problem
- Linear Patterns Graphing
- Linear Patterns and Graphs
- Linear Patterns and Plotting
- Algebra Linear Patterns
- Describing Linear Patterns
- Linear Patterns in Data
- Recognize Linear Patterns
- Extending Linear Patterns
- Growing Linear Patterns
- Simple Linear Patterns
- Non Linear Patterns


