Curated OER
Least Squares Fit Line
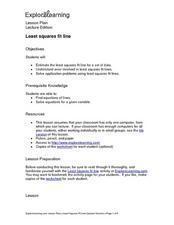
Practice makes perfect! Learners estimate the least squares fit line for a set of data. They understand error involved in least squares fit lines, and solve application problems using least square fit lines.
Virginia Department of Education
Line of Best Fit
Pupils work through a guided activity on fitting a linear equation to a set of data by entering the data into a calculator and trying to envision a line of best fit. They then have the calculator determine the least-squares line and...
PHET
Least-Squares Regression
Less is best when looking at residuals. Scholars use an interactive to informally fit a linear regression line to data on a scatter plot. The interactive provides a correct best fit line with residuals and correlation coefficient to...
CK-12 Foundation
Least-Squares Regression
Residual plots let you find the perfect line of best fit. As users adjust the points on a scatter plot and a possible line of best fit, the interactive automatically changes the residual plot. This change allows them to see connections...
Curated OER
Least Squares Fit Line
Pupils estimate the least squares fit line for a set of data. They understand error involved in least square fit lines. They solve application problems using least square fit lines.
Curated OER
Linear Systems: Least Squares Approximations
In this least squares approximation activity, students determine the number of solutions a given linear system has. They find the least square error and the equation of a line of best fit for a set of three points. Students find the...
Kenan Fellows
Least Squares Linear Regression in R
The task? Determine the how effective hospitals are at reducing the rate of hospital-acquired infections. The method? Data analysis! Using an open source software program, individuals use provided data and create scatterplots to look for...
Curated OER
Influence and Outliers
Using the TI-Nspire calculator, statisicians identify outliers and their effect on the least-squares regression line. In finding the line of best fit, they determine what points will affect the least squares regressions and what points...
Curated OER
Numerical Analysis: Discrete Least Squares
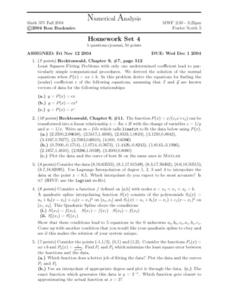
In this discrete least squares worksheet, students use a linear algebra approach to discrete last squares approximation. This two-page worksheet contains approximately 10 problems.
Curated OER
Linear Systems: Least Squares Approximations
In this least squares approximation worksheet, students use linear algebra to find the least square error and the equation of a line for given points. They find the equation of a parabola through provided points. This four-page...
EngageNY
Interpreting Residuals from a Line
What does an animal's gestation period have to do with its longevity? Use residuals to determine the prediction errors based upon a least-square regression line. This second lesson on residuals shows how to use residuals to create a...
EngageNY
Modeling Relationships with a Line
What linear equation will fit this data, and how close is it? Through discussion and partner work, young mathematicians learn the procedure to determine a regression line in order to make predictions from the data.
EngageNY
More on Modeling Relationships with a Line
How do you create a residual plot? Work as a class and in small groups through the activity in order to learn how to build a residual plot. The activity builds upon previous learning on calculating residuals and serves as a precursor to...
Curated OER
Numerical Analysis: Polynomials
For this polynomial worksheet, students explore functions, determine the least square error, and explore quadratic spline interpolation. This two-page worksheet contains approximately six problems.
EngageNY
Analyzing Residuals (Part 1)
Just how far off is the least squares line? Using a graphing calculator, individuals or pairs create residual plots in order to determine how well a best fit line models data. Three examples walk through the calculator procedure of...
Curated OER
Texting and Grades II
Given the least squares regression line, interpret the slope and intercept in the context of the relationship between texting and GPA. Although this task is short and looks simple, some subtle points can be brought to light in a...
Inside Mathematics
Quadratic (2009)
Functions require an input in order to get an output, which explains why the answer always has at least two parts. After only three multi-part questions, the teacher can analyze pupils' strengths and weaknesses when it comes to quadratic...
Curated OER
The Very Busy Spider
Youngsters explore visual arts by participating in a geometry identification activity. They read the book The Very Busy Spider and identify the techniques spiders use to create webs. Have you ever noticed that their webs are geometric...
Curated OER
Worksheet 19
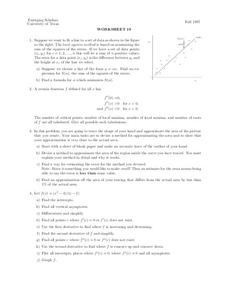
In this math worksheet, students try to fit a line to a set of data. Then they use the least squares method is based on minimizing the sum of the squares of the errors.
Howard County Schools
Setting the Table
How many people can fit around a table? Depends on the size of the table, right? Explore patterns to generate an equation for the number of people that can fit around a table given its size.
Illustrative Mathematics
Ordering Fractions
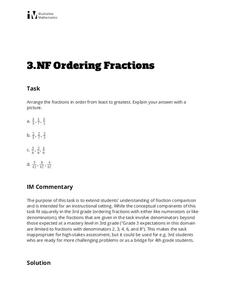
Here is a comparing and ordering fractions learning activity that extends young mathematicians understanding of fractions with like and non-like denominators. By representing and explaining each fraction in a picture or diagram, students...
Illustrative Mathematics
What Shape Am I?
Sharpen your pencil and grab a ruler, it's time to draw some quadrilaterals! Given the definition of a parallelogram, rectangle, and rhombus, learners draw examples and nonexamples of each figure. The three definitions are then used to...
Curated OER
Numerical Analysis: Using the QR Algorithm
In this QR algorithm worksheet, students use the QR algorithm to solve an over-determined system of equations. This two-page worksheet contains 11 problems.
American Statistical Association
EllipSeeIt: Visualizing Strength and Direction of Correlation
Seeing is believing. Given several bivariate data sets, learners make scatter plots using the online SeeIt program to visualize the correlation. To get a more complete picture of the topic, they research their own data set and perform an...


