Curated OER
Analog Clock Faces: Drawing Hands on Analog Clocks Telling Digital Time in 5 Minute Intervals
In this telling time worksheet, students study 9 blank clocks with a digital time written below. Students draw the hands on the clocks to match the times that are to the nearest 5 minutes.
Curated OER
Extrema on an Interval
Students explore maximum and minimum points, slopes and tangents. In this Pre-Calculus activity, students solve optimization problems and find rates of change.
Curated OER
Cookie Topography
Learners construct a cross section diagram showing elevation changes on a "cookie island." Using a chocolate chip cookie for an island, they locate the highest point in centimeters on the cookie and create a scale in feet. After tracing...
Curated OER
How To Measure Time
Students practice telling time on an analog clock. In this time measurement lesson, students use individual analog clocks to identify the hour and minute hand. Students identify how to tell time by moving the hour and minute hand.
Curated OER
Time
Here, learners review telling time using an analog clock. They use a clock to tell time, make a paper clock, and discuss the concept of elapsed time. However, the lesson plan is not always easy to follow, nor are the questions clear.
Curated OER
Time to Five Minutes: Homework
In this five minute interval counting worksheet, students describe each time as minutes after an hour and minutes before an hour. Students use the analog clocks to answer and finish with one word problem for telling time.
Curated OER
Blank Bar Graph- Intervals of 3
In this bar graph worksheet, students use the blank bar graph grid to display data. The interval is counting by 3. There are no problems given.
PLS 3rd Learning
Interpreting Heart Rates During Various Physical Activities
Learners review terminology: pulse, heart rate, target heart rate zone. They work in three groups, and assigned to one of three activity stations. At 5-minute intervals, 4th graders check their pulse and record it on their group card....
Curated OER
Time to Cook!
Don't let the cupcakes burn! Using cooking procedure, learners practice drawing minute and hour hands onto five analog clock faces. They read five scenarios which require them to add time increments to find the time required for each...
Curated OER
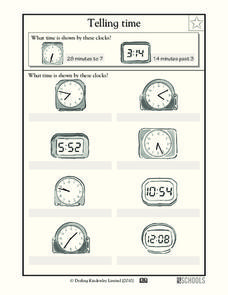
Telling Time
Tick tock! Test your third graders' time skills by providing both analog and digital clocks for pupils to decipher. Most of the times are between five minute intervals, prompting your class to really interpret each stroke of the clock....
Illustrative Mathematics
Velocity vs. Distance
At the end of this activity, your number crunchers will have a better understanding as to how to describe graphs of velocity versus time and distance versus time. It is easy for learners to misinterpret graphs of velocity, so have them...
Curated OER
In the Billions and Exponential Modeling
Modeling population growth gives learners an opportunity to experiment with real data. Comparing the growth rates in this real-life task strengthens learners' understanding that exponential functions change by equal factors over equal...
EngageNY
Two Graphing Stories
Can you graph your story? Keep your classes interested by challenging them to graph a scenario and interpret the meaning of an intersection. Be sure they paty attention to the detail of a graph, including intercepts, slope,...
University of North Texas
Reading Graphs
There is more to the eye than just a graph on paper. The presentation shows three different piecewise graphs and asks an assortment of questions. The resource includes topics such as domain and range, intervals of increasing and...
Charleston School District
Pre-Test Unit 3: Functions
How does an input affect an output? Assess your learners' ability to answer this question using this pre-test. Scholars answer questions about the basics of a function. Topics include determining if a table or statement represents a...
Charleston School District
Constructing Scatter Plots
Having more letters in your name helps you get a better grade in your math class—or does it? Learners create scatter plots to organize data. The lesson places emphasis on determining scale and intervals and labeling axis.
Mathematics Assessment Project
Multiplying Cells
Powers of two: it's a matter of doubling. A short summative assessment task asks pupils to determine a process to calculate the number of cells at given time intervals. They use powers of two in order to calculate the number of cells and...
EngageNY
Graphing the Tangent Function
Help learners discover the unique characteristics of the tangent function. Working in teams, pupils create tables of values for different intervals of the tangent function. Through teamwork, they discover the periodicity, frequency, and...
EngageNY
A Critical Look at Proportional Relationships
Use proportions to determine the travel distance in a given amount of time. The 10th installment in a series of 33 uses tables and descriptions to determine a person's constant speed. Using the constant speed, pupils write a linear...
EngageNY
Square Roots
Investigate the relationship between irrational roots and a number line with a resource that asks learners to put together a number line using radical intervals rather than integers. A great progression, they build on their understanding...
EngageNY
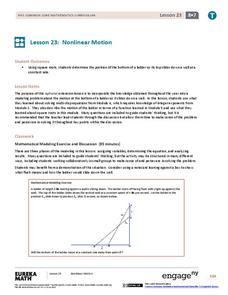
Nonlinear Motion
Investigate nonlinear motion through an analysis using the Pythagorean Theorem. Pupils combine their algebraic and geometric skills in the 24th lesson of this 25-part module. Using the Pythagorean Theorem, scholars collect data on the...
Mathematics Vision Project
Features of Functions
What are some basic features of functions? By looking at functions in graphs, tables, and equations, pupils compare them and find similarities and differences in general features. They use attributes such as intervals of...
CK-12 Foundation
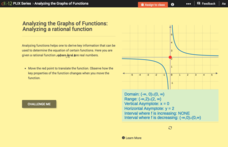
Analyzing the Graphs of Functions: Analyzing a Rational Function
Shift the function and transform the key features of the graph. By translating the graph of the rational function, class members find out how the key features alter. Pupils determine the domain, range, asymptotes, and intervals of...
101 Questions
Gas Station Ripoff
Ever wonder if you can trust the pump that pumps your gas? Budding mathematicians use video evidence to analyze the cost-per-gallon ratio at different intervals for three different pumps. Their goal is to identify the pump that is...
Other popular searches
- 5 Minute Intervals
- Major Intervals
- Music Intervals
- 1 Minute Intervals
- Intervals Number Line
- Five Minute Intervals
- Contour Intervals
- Graph Intervals
- Confidence Intervals
- Bar Graph Intervals
- Class Intervals
- Time Intervals


