Curated OER
Identifying Patterns
Explore number attributes and skip counting through patterns! Scholars find the pattern in each of these sequences and continue it by writing in the remaining values. They count consistently by various intervals, sometimes forwards and...
Curated OER
Explorations 5: Introduction to Limits
In this limit worksheet, students find the interval values of given functions. They identify constants, and plot graphs. This three-page worksheet contains approximately 20 problems.
Curated OER
Time to Five Minute Intervals
In this time worksheet, 3rd graders practice writing time to the five minute interval using analog clock faces. They write the time on the line under each of 9 clock faces.
Curated OER
Two-sided Confidence Interval for a Population Proportion
In this two-sided confidence interval instructional activity, students solve 3 problems to include constructing a confidence interval for a population proportion with a large sample. First, they split the confidence and shad its...
Curated OER
Intervals
In this intervals worksheet, students solve and complete 8 various types of problems. First, they find the intervals of x for each curve. Then, students sketch a graph of each showing all maximum and minimum points and all inflection...
Curated OER
Working with Sets
In this Algebra II worksheet, 11th graders use interval notation to represent a set of numbers. The one page worksheet contains one problem. Answer is provided.
Curated OER
Measuring Speed in the Universe
In this measuring speed in the universe worksheet, learners use photographs of 3 astronomical phenomena including supernova explosions, coronal mass ejections and solar flare shock waves to find how fast they move. The photographs show...
EngageNY
Interpreting the Graph of a Function
Groups sort through NASA data provided in a graphic to create a graph using uniform units and intervals. Individuals then make connections to the increasing, decreasing, and constant intervals of the graph and relate these connections...
Curated OER
Piecewise Practice Problems
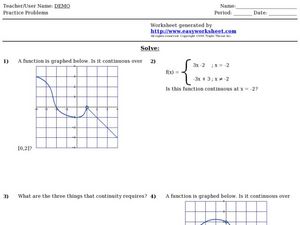
In this algebra activity, students validate continuity of a graph by a defined interval as well as determine continuity of a piecewise function.
Curated OER
Coloring Interval Graphs
Young scholars investigate planning an activity and getting it done on time. In this algebra instructional activity, students define vocabulary words related quadratic equations, including the vertex and intervals. They figure a good way...
Curated OER
Return Intervals & Reasoning from Tabular Data
Students calculate derivatives from a set of data. In this calculus lesson, students estimate the limit at infinity. They complete a Return Interval handout at the end of the lesson.
CK-12 Foundation
Continuity at a Point, Continuity Test, Types of Discontinuity: Properties of Continuous Functions
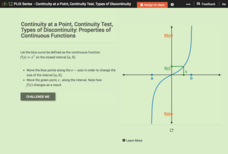
Take a closer look at continuous functions within given intervals. Using the parent cubic function, learners explore properties of continuous functions on intervals. Pupils interpret the Intermediate Value Theorem and the Extreme Value...
Curated OER
Mathematics: A Picture's Worth a Thousand Words
Students examine school yearbooks from 1950 to the present. They count the number of male and female teachers and administrators. They compile date and extrapolate changes in job trends.
EngageNY
Graphs of Piecewise Linear Functions
Everybody loves video day! Grab your class's attention with this well-designed and engaging resource about graphing. The video introduces a scenario that will be graphed with a piecewise function, then makes a connection to domain...
Mathed Up!
Frequency Polygons
Frequency polygons are a different way to represent frequencies over intervals. Pupils take frequencies for intervals of data from a frequency table and plot them as a frequency polygon. Budding mathematicians find information about the...
EngageNY
Mid-Module Assessment Task - Algebra 1 (Module 3)
Having trouble finding performance task questions? Here is an assessment that uses all high-level thinking questions. It includes questions to assess sequences, linear functions, exponential functions, and increasing/decreasing intervals.
Concord Consortium
Boards I
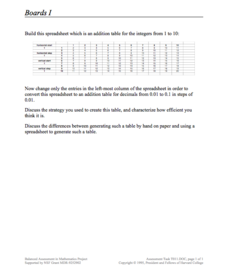
Learners create patterns in a table to mimic the function of an electronic spreadsheet. The result is a table that creates an addition table for decimals in intervals of one-tenth. While creating the pattern, pupils must thoroughly...
Concord Consortium
Boards II
Build spreadsheet skills while investigating decimal multiplication. An open-ended task asks learners to edit a spreadsheet to create a multiplication table for decimals. Provided with a specific interval, pupils create formulas that...
Curated OER
Piecewise-Defined Functions 2
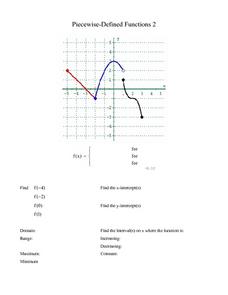
In this Piecewise-Defined function worksheet, 10th graders identify the function for a given graph. Additionally, they find the y-intercept, y-intercept, domain, range and interval of each function. Students solve this information for...
Curated OER
Exploration 1: Instantaneous Rate of Change Function
In this function activity, students read word problems and write functions. They determine the instantaneous rate of change and identify intervals. This three-page activity contains approximately 20 problems.
Curated OER
What Time is it? (A)
First and second graders learn how to tell time using illustrations of an analog clock. Eight clocks are shown, each representing a different five-minute interval. Answers are provided on the second sheet.
Curated OER
Time 5 Minutes
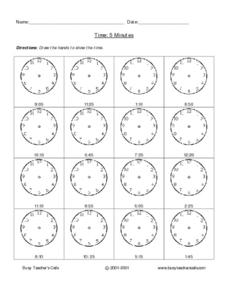
If your learners have already been introduced to telling time in five-minute intervals, this resource will provide extra practice! Or consider using it as a formal assessment. Have your learners developed time-telling skills?
Curated OER
Graphs and Transformations of Functions
Is it possible to solve quadratic equations by factoring? It is, and your class will graph quadratic equation and functions too. They perform transformation on their graphs showing increasing and decreasing intervals, domain, and range....
Curated OER
Equal Factors Over Equal Intervals
Exponential functions and their growth rates are explored concretely using tables in a collaborative task. Then the successive quotient is explored algebraically.
Other popular searches
- 5 Minute Intervals
- Major Intervals
- Music Intervals
- 1 Minute Intervals
- Intervals Number Line
- Five Minute Intervals
- Contour Intervals
- Graph Intervals
- Confidence Intervals
- Bar Graph Intervals
- Class Intervals
- Time Intervals


