Achieve
BMI Calculations
Obesity is a worldwide concern. Using survey results, learners compare local BMI statistics to celebrity BMI statistics. Scholars create box plots of the data, make observations about the shape and spread of the data, and examine the...
Georgetown University
Cup-Activity: Writing Equations From Data
Determine how cup stacking relates to linear equations. Pupils stack cups and record the heights. Using the data collected, learners develop a linear equation that models the height. The scholars then interpret the slope and the...
Curated OER
Rates of Chemical Reactions-The Iodine Clock Reaction
Learners investigate the reaction rate of iodine and soluble starch. In this rates of chemical reactions lesson plan, students study the effects of varying concentrations of reactants and varying temperatures of reactants on the reaction...
NOAA
Subduction Zones
Sink into an interactive learning experience about subduction zones! Junior oceanographers examine the earth-shaking and earth-making effects of subduction in the fourth installment in a 13-part series. Hands-on activities include...
Serendip
Changing Biological Communities – Disturbance and Succession
After cutting down a forest to make a farm, how long would it take the environment to turn an abandoned farm back into a forest? Scholars study this exact scenario while they interpret many charts and graphs of the changing ecosystems as...
CK-12 Foundation
Flashlight
In a simple circuit, does electricity start instantly? A simulation encourages thinking about the flow of electrons at a microscopic level. Pupils control the voltage, resistance, and switch in order to observe the change in both ideal...
PBS
Analyzing Light Curves of Transiting Exoplanets
Scientists detected exoplanets by measuring how the brightness of stars changed over time. Young astronomers interpret and analyze the same data that led to exoplanet discoveries. They learn to apply light curve graphs and connect the...
Utah Education Network (UEN)
Utah Open Textbook: Physics
Textbooks come in all shapes, sizes, and media these days. An electronic textbook resource offers Physics materials for an entire course. The text offers an explanation of physics topics as well as examples of calculations and reading...
Curated OER
Excel temperature Graphs
Students gather data about the weather in Nome, Alaska. For this Nome Temperature lesson, students create an excel graph to explore the weather trends in Nome. Students will find the average weather and add a trend line to their...
Curated OER
Forces and Graphing
Students analyze graphs to determine relationships between variables and rates of change. They determine the basic concepts about static reaction forces. They determine the slope and equation of a line.
Curated OER
Applied Science - Science and Math Post-Lab
Students explore optical illusions. In this Applied Science instructional activity, students view optical illusions and record the data of what they see. Students graph the data that they collect.
Curated OER
Endangered Species
Ninth graders graph data in order to compare the number of extinct species and a rise in human population. They analyze the data collected. Students are encouraged to infer the relationship.
Columbus City Schools
To Measure its Mass or Volume?
Atoms, elements, and molecules, oh my! Teaching the fundamentals of chemistry to curious sixth graders has never been easier to accomplish. Here is a resource that pulls together everything needed to get them off to a good start,...
Curated OER
Using the Very, Very Simple Climate Model in the Classroom
Students study the relationship between the average global temperature and carbon dioxide emissions. In this weather lesson students develop a test scenario using a model then read and interpret graphs of data.
Curated OER
Determination of Tensile Stress-Strain Common Properties in Materials
Students demonstrate the relationship between stress and strain, then graph stress-strain curves for various common materials. Students interpret graphed results and discuss differences in mechanical properties of materials.
Curated OER
Math & Social Science
Students are given data and are to calculate averages and yearly totals of how many cars travel the Tacoma Narrows Bridge. They also make a graph of the data.
Curated OER
Sunspot Graphing
Students, using 15 years of sunspot data, plot data on a classroom graph. They discuss why the pattern from their individual sheets did not and could not match the class graph.
Curated OER
Making and Interpreting Tables
In this data tables instructional activity, middle schoolers make and interpret data tables given data about magazine sales. They categorize their data, complete their data table and answer questions about their data.
Curated OER
A Steep Hike
Students explore slope. In this middle school mathematics lesson, students analyze and interpret graphs as they investigate slope as a rate of change. Students use a motion detector to collect data as they walk at different...
Concord Consortium
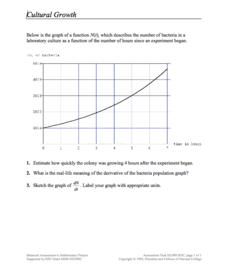
Cultural Growth
Scholars read and interpret a graph relating bacterial growth in a culture over time. They apply knowledge of derivatives, estimation, and graphing to the skill practice questions.
Towson University
Looking Backwards, Looking Forward
How do scientists know what Earth's climate was like millions of years ago? Young environmental scholars discover how researchers used proxy data to determine the conditions present before written record. Grouped pupils gain experience...
Curated OER
A world of oil
Students practice in analyzing spatial data in maps and graphic presentations while studying the distribution of fossil fuel resources. They study, analyze, and map the distribution of fossil fuels on blank maps. Students discuss gas...
Teach Engineering
The Energy Problem
Think you can solve the energy problem? You'll first need to know about current energy use. Analyzing a set of circle graphs lets scholars see where energy consumption is the greatest, both by sector and by household use. They develop a...
National Security Agency
What’s Your Coordinate?
Your middle schoolers will show what they know with their bodies when they become the coordinate plane in this conceptual development unit. Starting with the characteristics of the coordinate plane, learners develop their skills by...


