West Contra Costa Unified School District
Exploring Quadratics and Graphs
Young mathematicians first graph a series of quadratic equations, and then investigate how various parts of the equation change the graph of the function in a predictable way.
West Contra Costa Unified School District
Families of Functions Sort
Have some fun with functions with a short activity that asks learners to first sort scatter plot in terms of their correlation. They then sort graphs of different types of functions in terms of key features, such as slope.
West Contra Costa Unified School District
Using Derivatives to Graph Polynomials
You can learn to graph as well as a calculator using calculus. The lesson introduces using derivatives to find critical points needed to graph polynomials. Pupils learn to find local maximums and minimums and intervals of increase...
Mathematics Vision Project
Module 3: Polynomial Functions
An informative module highlights eight polynomial concepts. Learners work with polynomial functions, expressions, and equations through graphing, simplifying, and solving.
Statistics Education Web
Text Messaging is Time Consuming! What Gives?
The more you text, the less you study. Have classes test this hypothesis or another question related to text messages. Using real data, learners use technology to create a scatter plot and calculate a regression line. They create a dot...
Mathematics Vision Project
Modeling Data
Is there a better way to display data to analyze it? Pupils represent data in a variety of ways using number lines, coordinate graphs, and tables. They determine that certain displays work with different types of data and use...
Howard County Schools
Planning for Prom
Make the most of your prom—with math! Pupils write and use a quadratic model to determine the optimal price of prom tickets. After determining the costs associated with the event, learners use a graph to analyze the break even point(s).
Kenan Fellows
Multivariate Least Squares Regression Model with Variable Selection
The risk of contracting an infection in the hospital is low, but it does happen. Learn what risk factors have the highest correlation with hospital-acquired infections in the final lesson of a three-part series. Using the open source R...
Me and My Shadow
Trace My Shadow
Which creates more digital traces: surfing the Internet in a coffee shop, or using an iPhone to send a text message? The answer may surprise you! An interactive resource prompts users to choose which devices, operating systems, and...
Mathematics Vision Project
Module 9: Modeling Data
How many different ways can you model data? Scholars learn several in the final module in a series of nine. Learners model data with dot plots, box plots, histograms, and scatter plots. They also analyze the data based on the data...
College Board
Random Variables vs. Algebraic Variables
Variables can vary in meaning. A reference material for AP® Statistics explains the difference between random and algebraic variables. It provides a hypothetical situation involving dice—great for use in a classroom situation.
Curated OER
Slope of a Line
In this interactive activity, 8th graders review how to calculate the slope of a line, then solve 10 problems, given 2 points. Students may click for further information, on finding a slop of a line.
Curated OER
Plugging Into The Best Price
Examine data and graph solutions on a coordinate plane with this algebra lesson. Young problem-solvers identify the effect of the slope on the steepness of the line. They use the TI to graph and analyze linear equations.
Illustrative Mathematics
Two Lines
Here is a resource that helps your algebra learners understand the connection between the graph of two lines, the equations of lines, and the solutions and intersecting points of lines. It would make a great assessment question, but can...
Ms. Amber Nakamura's Mathematics Website
Algebra Project
What would your dream house look like? A cottage? A medieval castle? High schoolers enrolled in Algebra design the perfect house while using slopes to write equations for various aspects of the project.
Curated OER
Off to College
High schoolers investigate linear, quadratic and exponential equations using the TI calculator. They identify relation and functions using ordered pairs, graph the data, analyze the data, and relate it to real-world situations.
Virginia Department of Education
Transformation Investigation
Graph it! Investigate transformations with a graphing calculator. Pupils graph sets of linear functions on the same set of axes. They determine how changes in the equation of a linear function result in changes in the graph.
Curated OER
Geometry: Parallel and Perpendicular Lines
This basic handout would be good for skills practice or a review of parallel and perpendicular lines. Review the definitions, then practice writing equations of lines that pass through a specific point and are either parallel or...
Curated OER
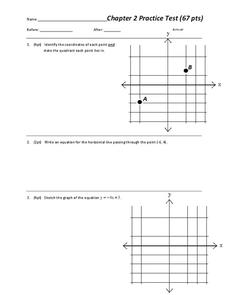
Chapter 2 Practice test
Overall, this worksheet contains a good selection of problems that reviews different aspects of linear equations. Learners examine and graph linear equations, absolute value equations, and inequalities in two variables. The three page...
Curated OER
Write an Equation of a Line Given Slope and a Point
Ninth graders are investigating slope of a line. The line is plotted using the slope and points on a line. They also write an equation given the right information. The use of a PowerPoint is part of the presentation.
Curated OER
Building Boxes- Polynimial And Rational Functions
Students investigate the concepts of polynomial and rational functions. They identify the general patterns used to solve problems. The use of real world contexts in the problems helps to promote engagement and understanding of how the...
Curated OER
Parallel Lines and Properties of Slope
Students define functions to be graphed using the Y=key. They demonstrate how to set up a standard viewing screen using Zoom 6. They discuss and explore mathematical questions on a worksheet.
Curated OER
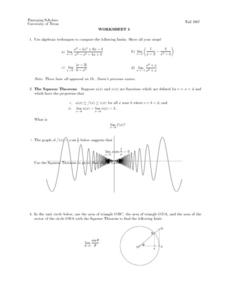
Worksheet 5 - Squeeze Theorem
For this Squeeze Theorem worksheet, students compute limits, identify a graph that represents the Squeeze Theorem, and graph given functions. This two-page worksheet contains seven multi-step problems.
Curated OER
Skirmish Ball
Build character while playing a fun game. The class practices throwing and catching in this game, which is based on honesty and team work. Take a look at this lesson and see if your class is up to the task.
Other popular searches
- Slope Intercept Form
- Slope and Y Intercept
- Slope Intercept
- Y Intercept
- X and Y Intercepts
- Slope Intercept Form
- X Intercept
- Y Intercepts
- Slope Intercept
- Slope Intercept Equation
- Slope and Y Intercept
- Writing Slope Intercept Form


