EngageNY
Using Linear Models in a Data Context
Practice using linear models to answer a question of interest. The 12th installment of a 16-part module combines many of the skills from previous lessons. It has scholars draw scatter plots and trend lines, develop linear models, and...
Curated OER
Sampling Bias And the California Recall
Using a 2002 California Gray David recall vote as an example, young statisticians identify sources of bias in samples and find ways of reducing and eliminating sampling bias. They consider ways to select random samples from a...
Curated OER
Bird Ecology Unit
Birds, plants, and vegetation, is there anything more lovely? There is! Engage your class in the scientific process, data collection, and data analysis. They stroll their campus observing and identifying various birds and plants,...
Curated OER
Exercise and the Human Heart
Interpret data and learn about the human heart in one activity! After learning about the way blood flows in the body, fifth graders answer two questions about a graph displaying pulse rate. They then take their own pulses to find the...
Curated OER
Interpreting Data from Birdfeeders
What kinds of birds live in your area? Read a book about birds to your learners and explore their feeding patterns. Charts and graphs are provided in this three page packet, but consider assigning the basic questions if using with young...
Consortium for Ocean Leadership
Nannofossils Reveal Seafloor Spreading Truth
Spread the word about seafloor spreading! Junior geologists prove Albert Wegener right in an activity that combines data analysis and deep ocean exploration. Learners analyze and graph fossil sample data taken from sites along the...
Curated OER
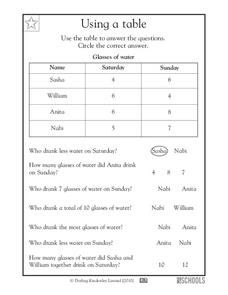
Using a Table
Tables are no help if your scholars can't read them; provide some excellent beginner-practice using this table example and accompanying comprehension questions. Learners examine the data first, which charts the number of glasses of water...
Curated OER
NUMB3RS - Season 2 - "Convergence" - Air Hockey
Learn how to use a matrix to organize data to solve a problem. This activity uses wins and losses to rank players for an air hockey tournament they wish to have. After practicing some basic matrix operations the class could do the...
National Wildlife Federation
When It Rains It Pours More Drought and More Heavy Rainfall
Which is worse — drought or flooding? Neither is helpful to the environment, and both are increasing due to climate change. The 16th lesson in a series of 21 covers the average precipitation trends for two different climates within the...
Curated OER
Independent Plant Growth Experiment
This is an awesome lesson filled with tons of engaging learning activities. Over a period of weeks learners will make observations, collect plant and analyze plant data, read and review agricultural articles, design and conduct an...
Federal Reserve Bank
Invest in Yourself
What are the different ways that people can invest in their human capital for a better future? Pupils participate in an engaging hands-on activity and analyze data regarding unemployment, the ability to obtain an education, and median...
College Board
Civic Knowledge and Action: Voter Registration
What does the data say? Using provided voter data from the 2016 presidential election, scholars describe the data and identify questions they could answer by analyzing it. Learners then construct tables and use them to determine whether...
Curated OER
Neighborhood or Slum? Snapshots of Five Points: 1827-1867
How has your local neighborhood changed throughout recent history? Young researchers evaluate census data, images, and primary source descriptions describing the living situation in the antebellum Five Points neighborhood. They consider...
Curated OER
Weather, Data, Graphs and Maps
Students collect data on the weather, graph and analyze it. In this algebra lesson, students interpret maps and are able to better plan their days based on the weather reading. They make predictions based on the type of clouds they see.
ARKive
Handling Data: African Animal Maths
Handling and processing data is a big part of what real scientists do. Provide a way for your learners to explore graphs and data related to the animals that live on the African savannah. They begin their analysis by discussing what they...
EngageNY
Modeling a Context from Data (part 1)
While creating models from data, pupils make decisions about precision. Exercises are provided that require linear, quadratic, or exponential models based upon the desired precision.
Curated OER
Multi-dimensional Modeling of Ore Bodies Making Sense of Empirical Data
Math scholars identify four different rock types in that strata and use this identification and data to construct a two dimensional geologic cross-section. They use data tables to construct a three-dimensional geologic cross-section.
Curated OER
Representing Data 1: Using Frequency Graphs
Here is a instructional activity that focuses on the use of frequency graphs to identify a range of measures and makes sense of data in a real-world context as well as constructing frequency graphs given information about the mean,...
Curated OER
Vernier EasyData App
Used along with data collection devices, the EasyData Application for the TI-83 Plus/TI-84 calculator allows learners to use real data to learn math and science. Statistics, curve fits, and integrals are used to analyze the collected...
Curated OER
A Comparison Study of Water Vapor Data to Precipitation over North America
Students use NASA satellite data to compare water vapor over the United States. In this data analysis instructional activity students use an Excel spreadsheet to map their data.
Virginia Department of Education
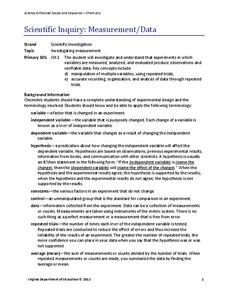
Scientific Inquiry: Measurement/Data
While pupils design their own lab experiments, they will not form a new species. Scholars take their materials and design an experiment regarding reaction rates.
Curated OER
Tallies
Tally Marks are a wonderful way to keep track of data, and to foster counting for your young mathematicians. This resource has learners identify the correct number of tally marks for a given number. The numbers used are: 13, 15, 17, and...
CK-12 Foundation
Misleading Graphs (Identify Misleading Statistics): Are Virgos Cursed?
Is it safe to take data at its face value? Pupils use the interactive to evaluate a claim that Virgos are more likely to get into a car crash than others. Individuals determine whether another variable may be at play.
Curated OER
Making Logic Out of Madness
Tenth graders organize and interpret data from a student health program. In this physical education lesson, 10th graders use a body composition analyzer over 8 weeks to determine the validity of a student health program. Data obtained...


