EngageNY
Ferris Wheels—Tracking the Height of a Passenger Car
Watch your pupils go round and round as they explore periodic behavior. Learners graph the height of a Ferris wheel over time. They repeat the process with Ferris wheels of different diameters.
EngageNY
Secant and the Co-Functions
Turn your class upside down as they explore the reciprocal functions. Scholars use the unit circle to develop the definition of the secant and cosecant functions. They analyze the domain, range, and end behavior of each function.
Balanced Assessment
Fit-Ness
Serve four towns with one bus route. Pupils develop a bus route that meets certain criteria to serve four towns. They determine which of the routes would best serve all of them. Individuals then hypothesize where a fifth town should be...
Mathematics Assessment Project
Middle School Mathematics Test 3
Real-life mathematics is not as simple as repeating a set of steps; pupils must mentally go through a process to come to their conclusions. Teach learners to read, analyze, and create a plan for solving a problem situation. The...
Bowland
Ice Cream
Make sure there is enough ice cream on hand. Learners try to find out how much ice cream to buy for a sports event. Scholars use a pie chart showing the percent of a sample of people who like different flavors of ice cream. Using the...
Curated OER
The Area of a Circle
Eighth graders find the circumference and diameter of several lids, show the relationship of the two measurements and derive the formula for finding the area of a circle. For this area of a circle lesson plan, 8th graders find...
Curated OER
Math Handbook: Trigonometry
You'll be spinning in unit circles once you read through this jumbo-sized resource of everything you need to know about trigonometry. Each page has color-coded examples with explicit directions that detail the problems and...
Mathematics Assessment Project
Sorting Equations of Circles 2
How much can you tell about a circle from its equation? This detailed lesson plan focuses on connecting equations and graphs of circles. Learners use equations to identify x- and y-intercepts, centers, and radii of circles. They also...
Curated OER
Looking for More Clues
Fifth graders explore how to collect data and display it on a bar and circle graph.
K12 Reader
Displaying Data
It's important to learn how to display data to make the information easier for people to understand. A reading activity prompts kids to use context clues to answer five comprehension questions after reading several paragraphs about...
Curated OER
MAP Practice
In this geometry activity, students create circle, line and bar graphs using different comparisons of events. There are 24 questions with an answer key.
Curated OER
Are You Full of Hot Air?
Explore the concept of measuring and recording circumference. In this physical science and measurement lesson, young learners blow up balloons, measure the circumference, and record the data on an interactive graphing website.
Curated OER
Charting and Graphing Sales
Students analyze and represent weekly sales figures using tables, bar graphs, and pie charts. They draw conclusions using bar graphs and pie charts. Students are told that each day at school they have the option of buying or bringing a...
Curated OER
Decisions, Decisions, Decisions
Students examine graphs to find the most appropriate for various kinds of data. In this graphing lesson, student create bar, line and circle graphs. Students create graphs electronically and manually interpreting the data.
Curated OER
The Numbers Tell the Story
Students demonstrate how to gather and interpret statistical data. In this data analysis instructional activity, students search for statistics on the health effects of smoking and place the information into charts. Students create these...
Illustrative Mathematics
Velocity vs. Distance
At the end of this activity, your number crunchers will have a better understanding as to how to describe graphs of velocity versus time and distance versus time. It is easy for learners to misinterpret graphs of velocity, so have them...
Curated OER
Budget Making
Learners develop a budget for spending and saving. In this economics lesson plan, students create a budget based on personal, family and government income. They discuss jobs at home and allowances. They discuss how they manage their...
Computer Science Unplugged
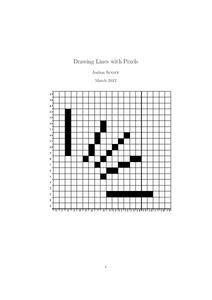
Drawing Lines with Pixels
How do the computers keep it straight? Using the provided algorithms, class members draw a line and a circle using pixels. They then check the drawings using a straight edge and compass to determine the accuracy of their...
Curated OER
Graphs, Stories, And Games
In this graphs lesson, young scholars read stories and present story situations on a graph. They explore distance and diameter and explain graphs. Students create their own stories to fit graphs.
Curated OER
I want a credit card--or do I?
Students pretend to borrow $1000.00 on a credit card. They pretend to make the minimum payments for a year. When they're done, they make a pie chart showing how much of their payments reduced their debt, and how much was interest.
Curated OER
Match The Graph Circles
High Schoolers engage in a study of circles and graphs that are related with the focus upon finding the center and radius. The lesson includes the suggestion of giving homework using circle problems before this one to create background...
Curated OER
What Pie?
Students practice making and interpreting pie graphs so they are better able to decide if a pie chart is the appropriate form of display. Students examine included overheads of different pie charts, and directions on how to make pie...
Utah Education Network (UEN)
Linear Graphs Using Proportions and Rates
Using a TI-73 or other similar graphing calculator middle school math majors investigate the linear relationship of equivalent proportions. After a brief introduction by the teacher, class members participate in a timed pair share...
EngageNY
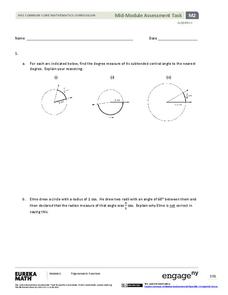
Algebra II Module 2: Mid-Module Assessment
Time for classes to show what they've learned. Use several tasks to assess understanding of the trigonometric functions, unit circle, radians, and basic trigonometric identities.
