Scholastic
Study Jams! Circle Graph
Over a pizza dinner, RJ and Mia discuss how to use a circle or pie graph to represent data. After viewing, data analysts can use a Test Yourself feature to assess their own understanding. This is ideal for use in a flipped classroom lesson.
Curated OER
Making a Circle Graph of a Sample Budget
Young scholars examine a sample budget and categorize the entries as a group. Then in small groups they convert budget category totals to percents and degrees to make a circle graph related to a sample budget.
Curated OER
Problem-Solving Application: Make a Circle Graph
In this circle graphs worksheet, students analyze a data table about the activities in a day. Students then use this data to make a circle graph. Students answer 6 questions about the graph.
Willow Tree
Circle Graphs
Pie isn't just for eating! Scholars learn to create pie charts and circle graphs to represent data. Given raw data, learners determine the percent of the whole for each category and then figure out the degree of the circle that percent...
Math Worksheets Land
Pie or Circle Graphs—Step-by-Step Lesson
How do you display data that you've collected in a pie chart? Follow a clear step-by-step guide to turning survey results into a visible format. It shows kids how to determine the percentage of the whole that each section represents.
Willow Tree
Bar Graphs
Circles, lines, dots, boxes: graphs come in all shapes in sizes. Scholars learn how to make a bar graph using univariate data. They also analyze data using those bar graphs.
World Wildlife Fund
Bar Charts & Pie Charts
Learn about life in the Arctic while practicing how to graph and interpret data with this interdisciplinary lesson. Starting with a whole group data-gathering exercise, students are then given a worksheet on which they analyze and create...
CK-12 Foundation
Interpretation of Circle Graphs: Northwest Region Population Pie
Given populations of the five Northwestern states, learners create a circle graph. Using the data and the pie chart, they make comparisons between the populations of the states. Finally, the pupils determine how the chart will change...
Curated OER
Introduction to Representing and Analyzing Data
Represent data graphically. Allow your class to explore different methods of representing data. They create foldables, sing songs, and play a dice game to reinforce the measures of central tendency.
Virginia Department of Education
May I Have Fries with That?
Not all pie graphs are about pies. The class conducts a survey on favorite fast food categories in a lesson on data representation. Pupils use the results to create a circle graph.
Curated OER
Review Graphing Parabolas & Circles
Students review how to graph parabolas. They practice graphing two different parabolas using the vertex and table method. They solve problems related to graphing circles, determining the radius and the center.
Curated OER
Making Circle Graphs
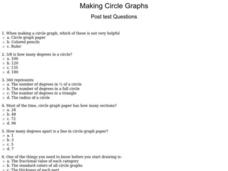
In this circle graphs worksheet, students answer multiple choice questions about how to make circle graphs. Students answer 10 questions total.
Curated OER
Creating Circles
Students make a circle graph. In this graphing lesson, the teacher conducts a class survey, then demonstrates how to make a pie graph. When students are comfortable with the material, they use a worksheet to create their own graph.
Virginia Department of Education
Circles in the Coordinate Plane
Make the connection between the distance formula and the equation of a circle. The teacher presents a lesson on how to use the distance formula to derive the equation of the circle. Pupils transform circles on the coordinate plane and...
EngageNY
Solution Sets to Simultaneous Equations (part 1)
How are systems related? Build on your pupils' previous knowledge of solving systems of equations by introducing systems of inequalities. Learners explore similarities between systems of equations and inequalities to make a strong...
Curated OER
Using Bar Graphs to Understand Voting Patterns
Bar graphs are used as a way to study voting patterns in the United States. A variety of statistical data is presented in the graphs, and pupils must interpret the data in order to make a report to the class. Three excellent graphs,...
Inside Mathematics
Squares and Circles
It's all about lines when going around. Pupils graph the relationship between the length of a side of a square and its perimeter. Class members explain the origin in context of the side length and perimeter. They compare the graph to the...
Mathematics Vision Project
Circles: A Geometric Perspective
Circles are the foundation of many geometric concepts and extensions - a point that is thoroughly driven home in this extensive unit. Fundamental properties of circles are investigated (including sector area, angle measure, and...
Mathematics Assessment Project
Sorting Equations of Circles 1
Round and round we go. Learners first complete a task on writing equations of circles. They then take part in a collaborative activity categorizing a set of equations for circles based on the radius and center.
Curated OER
The Power of Graphical Display: How to Use Graphs to Justify a Position, Prove a Point, or Mislead the Viewer
Analyze different types of graphs with learners. They conduct a survey and determine the mean, median and mode. They then identify different techniques for collecting data.
Curated OER
Discovering Pi/Welcome to Pi Day
Students explore pi. In this circle measurement lesson, students define and identify radius, diameter, circumference, and perimeter. Students work in groups to measure several plastic lids and record their findings. Students compare the...
Curated OER
Exploring Circles
High schoolers explore circles using a graphing calculator. For this circles lesson, students write the equation of a circle with a given center and radius length. High schoolers find the most appropriate model for each combination of...
Curated OER
Creating Circle Graphs using Excel
Fifth graders evaluate data from a circle graph that compares time spent on various activities. They use the computer to manipulate their own data as they compare, examine, create and evaluate data using circle graphs.
Curated OER
Using Circle Graphs
In this circle graphs instructional activity, students read a story about buying craft materials. Students examine the circle graph that shows how much spent on each type of material. Students then solve 3 problems using the data shown.


