Curated OER
Drive the Data Derby
Three days of race car design and driving through the classroom while guessing probability could be a third graders dream. Learn to record car speed, distances traveled, and statistics by using calculation ranges using the mean, median,...
Curated OER
Graphing Your Motion with Vernier LabQuests
Seventh graders create motion graphs using a motion sensor. In this physics lesson, 7th graders match the graph shown by moving their body. They relate the slope to the way they moved.
Curated OER
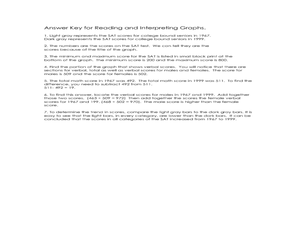
Reading and Interpreting Graphs Worksheet
In this bar graphs worksheet, students read and interpret a bar graph on SAT scores by answering short answer questions. Students complete 7 questions total.
Curated OER
Interpreting Graphs
Students investigate graphs. In this graphing lesson, students create a graph regarding the population of California. Students extrapolate answers concerning the data set.
Curated OER
Reading Graphs
Students practice plotting functions on the Cartesian coordinate plane, see several categories of functions, including lines and parabolas, and read a graph, answering questions about the situation described by the graph
Curated OER
Graphing
Students collect data to create different types of graphs-line, pie, and bar graphs. They use StarOffice 6.0 to create graphs.
Curated OER
Real Misleading Graphs
Learners identify real graphs and misleading graphs. In this algebra lesson plan, students surf the Internet for real life scenarios where graphs are used in a misleading way as well as in a correct way.
EngageNY
Interpreting the Graph of a Function
Groups sort through NASA data provided in a graphic to create a graph using uniform units and intervals. Individuals then make connections to the increasing, decreasing, and constant intervals of the graph and relate these...
Mathematics Assessment Project
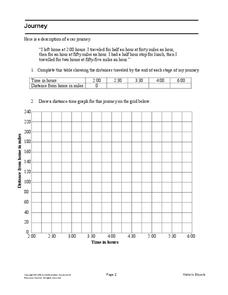
Journey
Drive home math concepts with an engaging task. Learners follow a verbal description to fill in a table and create a distance-time graph representing a car journey. They then answer questions by interpreting the graph.
Illustrative Mathematics
Logistic Growth Model, Abstract Version
Here learners get to flex some serious algebraic muscles through an investigation of logistic growth. The properties of the constant terms in the logistic growth formula are unraveled in a short but content-dense...
Illustrative Mathematics
Latitude
The greater the latitude, the less of the Earth is north. Scholars graph the relationship between the latitude and the percentage of the Earth that is north of the latitude. Using the graph and the table, class members interpret values...
EngageNY
Analyzing a Graph
Collaborative groups utilize their knowledge of parent functions and transformations to determine the equations associated with graphs. The graph is then related to the scenario it represents.
Balanced Assessment
Dollar Line
Challenge the class to develop a story that matches a graph. The short assessment provides a line graph with the vertical axis labeled as dollars. The task asks pupils to develop a description of a situation that could be represented by...
Concord Consortium
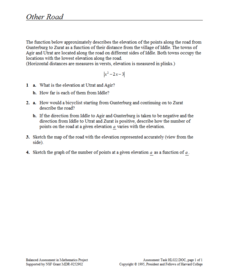
Other Road
Take the road to a greater knowledge of functions. Young mathematicians graph an absolute value function representing a road connecting several towns. Given a description, they identify the locations of the towns on the graph.
CK-12 Foundation
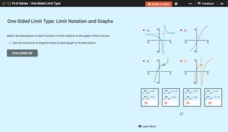
One-Sided Limit Type: Limit Notation and Graphs
A one-sided limit is no less important than a two-sided limit. Young mathematicians use an interactive to match limit notation to graphs. The exercise requires interpreting how one-sided limits connect to features of graphs.
EngageNY
Graphing Solutions to Inequalities
Activate the strengths of your visual learners using an informative instructional activity. In the 15th installment of the series of 28, pupils graph their solutions on number lines to create a visual representation of solutions....
National Security Agency
Are You Ready to Call the Guinness Book of Records?
Learners design questions that can be answered by collecting data. In this line-plot lesson, pupils collect data and graph on a line plot on world records. An abundant supply of teacher support is provided in this resource.
Curated OER
Data Collection
Students write a journal exercise that relates to pets. They collect information from each other in order to practice making and interpreting bar graphs. They Continue building different kinds of graphs with the group.
Curated OER
Graph it!
Sixth graders view a Stacked Graph, and discuss what it shows. Students discuss the basics of graphing: labels, intervals, legends x and y axis... Students create individual stacked graphs from provided information. Students view a...
Curated OER
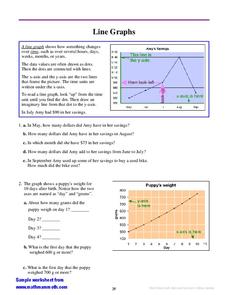
Line Graphs
In this interpreting line graphs activity, students read an explanation and observe an example of a line graph and its parts and then answer questions interpreting two line graphs. Students write eleven answers.
Curated OER
Comparing Data on Graph A and Graph B
Second graders gather and graph data. For this graphing lesson, 2nd graders collect data and graph this information using tally charts, bar graphs, pictographs, or tables. They make predictions about the outcomes.
Polar Trec
How Much Data is Enough?
The next time you read a magazine or watch the news, make note of how many graphs you see because they are everywhere! Here, scholars collect, enter, and graph data using computers. The graphs are then analyzed to aid in discussion of...
EngageNY
Representations of a Line
Explore how to graph lines from different pieces of information. Scholars learn to graph linear functions when given an equation, given two points that satisfy the function, and when given the initial value and rate of change. They solve...
NASA
The Big Climate Change Experiment Lesson 3: Climate Change Lines of Evidence
Consider the preponderance of evidence when making a verdict. The third of five lessons in Unit 1: The Big Climate Change Experiment focuses on the evidence for climate change. Learners study graphs, diagrams, and pictures regarding...
Other popular searches
- Interpret Charts and Graphs
- Interpreting Bar Graphs
- Interpreting Line Graphs
- Interpreting Circle Graphs
- Interpret Graphs
- Reading Graphs and Charts
- Graphs Interpreting Data
- Bar Graph Interpretation
- Reading Graphs in Science
- Timed Reading Graphs
- Interpreting Graphs Algebra
- Math Interpreting Bar Graphs


