CPO Science
Physics Skill and Practice Worksheets
Stop wasting energy searching for physics resources, this comprehensive collection of worksheets has you covered. Starting with introductions to the scientific method, dimensional analysis, and graphing data, these skills practice...
NASA
Global Air Temperatures Graph: Student Activity
Analyze years of hard climate change evidence in minutes. Climatologists evaluate graphical data about climate change by answering questions. Scientists work collaboratively using a literacy cube or virtual die that directs them through...
Curated OER
Making a Line Graph
In this line graph worksheet, students use data given in a table and assign axes, make a scale, plot data and make a line or curve on their constructed graphs.
Berkshire Museum
Camouflage!: Collecting Data and Concealing Color
Help young scholars see the important role camouflage plays in the survival of animals with a fun science lesson. Starting with an outdoor activity, children take on the role of hungry birds as they search for worms represented by...
Curated OER
Survey of Height
In this data collection instructional activity, students survey the heights of their fellow classmates, organize their data in a data table, and create a bar graph from their data. Once bar graph is completed, students complete 2 short...
Curated OER
How Soluble Is It?
Is sugar more soluble than salt? Experiment with water and solubility with an elementary science activity. After interpreting data from a bar chart, fifth graders use different types of sugar to determine if the size of sugar particles...
Curated OER
Organizing Data
In this data worksheet, students convert measurements to significant notation and determine the number of significant digits. This worksheet has 4 fill in the blank and 2 short answer questions.
University of Florida
A Walk in the Woods
Take class members on a field trip to the forest without leaving the classroom. Scholars learn content-related vocabulary and factors affecting forest health with class discussions and during a presentation. Scientists combine forestry...
Curated OER
Tables and Graphs Practice
In this table and graph worksheet, students are given three scenarios with data. They construct a table and a graph for each scenario.
Curated OER
Evolution Study Guide
Thirty short-answer questions comprise this detailed review of evolution theory. Many of the questions ask scholars to define vocabulary. Because short answers are required, this worksheet will take some time to complete. You could give...
Curated OER
Using Charts, Graphs, Tables, or Charts
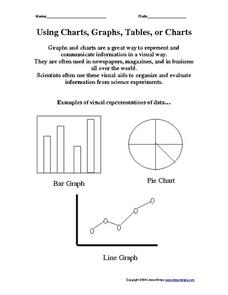
In this charts, graphs and tables activity, students view 3 different types of visual representations of data, make a list of 20 items and decide how the items can best be put together in groups to make a graph, chart or table. Students...
Curated OER
Tides at the Battery, NY
Skill in using Excel and increasing proficiency in manipulating data are challenged with this data analysis work. A web link supplies data and step-by-step instructions help learners create a graph. There are many extension...
CPO Science
Science Worksheets
If you need an array of worksheets to augment your science lessons, peruse a collection of assignments that is sure to fit your needs. With topics such as metric conversion, the scientific method, textbook features, research skills,...
Towson University
It's a Gassy World!
How much does your class know about the relationship between climate change and carbon dioxide? Science scholars explore the nature of greenhouse gases and rising ocean temperature through demonstrations, research, and experiments. The...
Curated OER
A Study of Astronaut Radiation Dosages
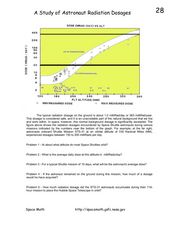
In this astronauts and radiation worksheet, students use a graph that shows the altitude of an astronaut versus the exposure to radiation to solve 5 problems. Students interpret the graph to express the amount of radiation at varying...
Curated OER
Standard One: Lab Design and Appendix A Lab Skills
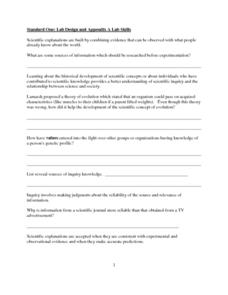
In this lab design and lab skills worksheet, high schoolers answer questions about experimental design including finding variables, determining controls, and graphing data. They answer questions about microscopy and label the parts of a...
Texas State Energy Conservation Office
Investigation: Gas Laws in Action - Propane
Using helium as an example of propane, physical science middle schoolers experiment with and graph the relationship between temperature and volume in gases. In a whole-class demonstration, they show how molecules behave under different...
University of Georgia
Freezing and Melting of Water
Examine the behavior of energy as water freezes and melts. An engaging activity provides a hands-on experience to learners. Collaborative groups collect data and analyze the graphs of the temperature of water as it freezes and then...
Edmond Public Schools
8th Grade Science Resource Book: Unit 2 - Physics
Get things moving with this extensive collection of physical science resources. Covering the fundamentals of measurement, graphing, lab safety, and experimental design as well as the specific scientific concepts...
Center for Learning in Action
Investigating Physical and Chemical Changes
Super scientists visit ten stations to predict, observe, and draw conclusions about the physical and chemical changes that occur when different states of matter—liquid, solid, and gas—are placed under a variety of conditions. To...
Pingry School
Gas Pressure and Temperature Relationship
Humans tend to huddle together when cold and move around more when warm, but do gas particles follow the same pattern? Scholars use a temperature probe, a pressure sensor, and air to study the relationship between temperature and gas...
Texas State Energy Conservation Office
Investigation: Water Wheel
Middle school scientists construct a working water wheel from an aluminum pie pan. Because of the sharp edges on the cut aluminum, this activity is for mature learners only. You could have your class compete to see whose wheel can lift...
Science Matters
Formative Assessment #2: Circulatory System Performance Assessment
Watch as your pupils' hearts get pumping! An interactive activity has individuals record their heart rates after completing different activities. Each task has a different degree of physical activity. They then graph their results and...
Curated OER
Weather Graph
In this graphing worksheet, 3rd graders study a line graph pertaining to weather. Students respond to 8 short answer questions using the information that is presented in the graph.
Other popular searches
- Graphing Skills Lesson Plans
- Basic Graphing Skills
- Organizing and Graphing Data
- Introducing Graphing Skills
- Graphing Skills Using M&ms
- Graphing Skills in Science
- Graphing Skills for Prek
- Graphing Skills With Fruits
- Graphing Skills in Chemistry
- Graphing Skills for Perk
- Graphing Skills Worksheet
- Reading Graphing Skills


