Curated OER
Route 66 And Population Patterns
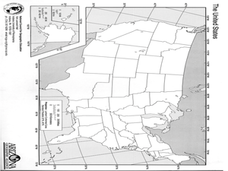
Students investigate the geography located along Route 66. They research how the population patterns change in certain areas along the highway. Students use the information in order to form hypotheses about how and why the population...
Curated OER
Zebra Mussel Population Simulation
Young scholars are taught how to format and enter data into an Excel spreadsheet. They make a graph, and interpret graphed data. Students discuss the possible impacts of zebra mussels on the Hudson river. They graph zebra mussel data.
Curated OER
Is there Treasure in Trash?
More people, more garbage! Young environmentalists graph population growth against the amount of garbage generated per year and find a linear model that best fits the data. This is an older resource that could benefit from more recent...
Science 4 Inquiry
Snakes in the Everglades
The Burmese python is on the loose ... and he's hungry! Illustrate the differences between causative and correlative relationships through an inquiry instructional activity. Pupils examine several sources of information to determine if...
Mathematics Vision Project
Module 4: Linear and Exponential Functions
Sequences and series are traditionally thought of as topics for the pre-calculus or calculus class, when learners are figuring out how to develop limits. But this unit uses patterns and slopes of linear functions in unique ways to bring...
CK-12 Foundation
Continuity of a Function: Continuity
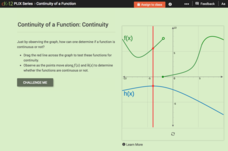
Does the point continually move along the graph? Pupils drag a line across two functions to determine whether they are continuous or not. They answer questions about the properties of continuous and discontinuous functions. Using their...
Curated OER
Horizontal Bar Graph: Changes in Nebraska Population
In this bar graph learning exercise, learners learn about the changes in Nebraska's population from 1880 to 2000 by studying a bar graph. Students answer 7 questions about the graph.
Curated OER
Human Populations Studies: the Ghost of Populations Past
High schoolers compile data on population distribution and develop survivorship curves using information from cemetery tombstones and obituaries. They develop inferences on the changes in population age distribution in their area over time.
Curated OER
Population and Population Density
High schoolers read and interpret graphs. For this population lesson, students explore population and population density as they read several data graphs and respond to questions.
Curated OER
Population Density
Students use the scientific method to conduct an experiment and use varied methods to gather background information. They correctly use lab equipment and prepare tables and graphs that organize, conclude, and present their findings. ...
Curated OER
Population Demographics
Learners explore how life expectancy has been able to increase in recent years. In this population instructional activity students complete several activities and create a graph.
Curated OER
Graphing in the Information Age
Students create a variety of graphs based on population data. In this statistics lesson, students use data that can be gathered on-line to make a bar chart, line graph, and circle graph.
Curated OER
Illuminating Climate Change: Connecting Lighting and Global Warming
Learners analyze energy usage and connect energy usage to fossil fuel consumption. In this global warming and pollution lesson, students what fuels are used to generate electricity and how much CO2 each fuel produces, then graph the...
Curated OER
Where is Everybody?
Students collect data from different grade levels at their school and develop thematic maps which show population density, and determine how this might affect the school and themselves in the future.
Curated OER
Canadian Social Trends
High schoolers use surveys to explore how to design graphs, tables, and diagrams. They discuss articles which can stimulate ideas for research topics, or surveys of their own.
School Improvement in Maryland
Demographic Investigation
What are the factors that influence voting patterns? How do these factors influence government funding? Is participation the squeaky wheel gets the grease? Class members interpret graphs and analyze trends to determine what demographic...
Curated OER
Explain the Change
Twelfth graders complete research relating to population changes in counties/states in the U.S. from 1900 to 2000 and use the slope formula to determine the overall change in population for each of the ten decades. They present their...
Curated OER
Carbon Monoxide and Population Density
Tenth graders investigate the carbon monoxide level at a fixed latitude to determine if there is a relationship to population density. They download data sets and generate a graph, and find locations using the Earth's coordinate system....
Curated OER
Population Ecology
Here are some ideas to help students understand population growth in ecosystems.
National Park Service
It's Not Easy Being Grizz
Grizzly bears can be up to 600 pounds and require a great deal of food, especially to survive hibernation. Comprised of multiple games, the third lesson of five only uses one setup. Pupils run around a large field, sorting and collecting...
Curated OER
Time Changes Everything
Learners analyze census data from 1915, 1967 and 2006. They read an article about how the world's population is growing at an alarming rate. They use primary source documents to create a timeline on the information they gathered. They...
Population Connection
Where Do We Grow from Here?
Did you know that the population is expected to grow to 11 billion by 2100? The resource serves final installment in a six-part series on the global population and its effects. Scholars interpret data from the United Nations about the...
Curated OER
Regents High School Examination: Living Environment 2010
This exam touches upon every topic within the typical first year biology course.. A broad variety of question styles give high schoolers every opportunity to show what they know. Why start from scratch when a comprehensive final exam is...
Curated OER
Population Models and Qualitative Analysis, Part 2
In this population model worksheet, students explore models of population growth using the Gompertz growth model and the exponential growth model. They sketch a graph of the slope function and determine possible solutions over time....


