Curated OER
Basic Algebra and Graphing for Electric Circuits
In this electronics worksheet, learners evaluate mathematical expressions to complete 16 short answer and problem solving questions.
Curated OER
Wrapping It All Up
Through learning how to examine linear, quadratic, and exponential functions, students explore the effects of changes in parameters on the graphs of linear, quadratic, and exponential functions. The instructional activity is designed to...
Curated OER
Calculus 30: Domain and Range
In this domain and range worksheet, students find the domain and range of 23 equations. Students find the domain and range from a graph and determine a graph given the domain and range.
Curated OER
Graphs Involving Absolute Value
In this Algebra I/Algebra II worksheet, students graph absolute value functions. The two page worksheet contains four multiple choice questions. Answers are included.
Curated OER
Connecting Factors and Zeros
In this Algebra II lesson, students explore the connection between the factored form of a quadratics and the zero of a function. Students use a graphing calculator to verify factoring numerically and graphically.
Curated OER
Getting Started with the TI-Navigator™ System: What's My Line?
Learners analyze linear functions in this algebra lesson. They explore the meaning of slope and the slope-intercept form of a line as they investigate the effect changing parameters on the graph of a linear function.
Curated OER
Integration: Geometry, Parallel and Perpendicular Lines
In this math worksheet, students write linear equations in slope-intercept form that passes through the given point. On the last 8 equations, students write the equation of the perpendicular line.
Virginia Department of Education
Inequalities
Compare graphing an inequality in one variable on a number line to graphing an inequality in two variables on a coordinate plane. Young mathematicians work on a puzzle matching inequalities and their solutions. They then complete a...
Mathematics Vision Project
Module 3: Polynomial Functions
An informative module highlights eight polynomial concepts. Learners work with polynomial functions, expressions, and equations through graphing, simplifying, and solving.
Achieve
Rabbit Food
Keep your pets slim, trim, and healthy using mathematics! Pupils use a linear programming model to optimize the amount and type of food to provide to a pet rabbit. They model constraints by graphing inequalities and use them to analyze a...
Curated OER
Functions and Slopes
In this function worksheet, students find the slope of a line tangent to a given graph, they derive formulas for the area and perimeter of a given right triangle, they graph functions, and compute the derivative of functions. This...
Charleston School District
Review Unit 3: Functions
Time to show what you know about functions! The review concludes a series of nine lessons on the basics of functions. The problems included are modeled from the previous lessons. Pupils determine if a table represents a function,...
Curated OER
Eighteen Slope-Intercept Form of a Line problems
In this line instructional activity, students solve eighteen problems related to slope, t-intercept, and equations of lines. Three of the problems are multiple choice, two are graphs, and the rest are free-response problems.
University of Utah
Functions
Define, explore, compare, and analyze functions with the fourth chapter of a 10-part eighth-grade workbook series. After encountering the definition of a function, pupils begin to explore linear and nonlinear functions. They then work...
EngageNY
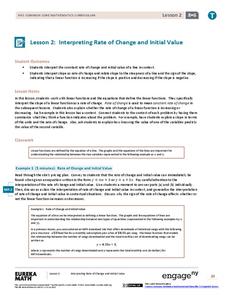
Interpreting Rate of Change and Initial Value
Building on knowledge from the previous lesson, the second lesson in this unit teaches scholars to identify and interpret rate of change and initial value of a linear function in context. They investigate how slope expresses the...
Explore Learning
Quadratics: Polynomial Form
Throught this subscription-based sight, learners explore different aspects of the parabola by changing equations from standard to vertex form. Next, find the general form of the vextex based on the values of a, b, and c, and investigate...
PBL Pathways
Students and Teachers
Predict the future of education through a mathematical analysis. Using a project-based learning strategy, classes examine the pattern of student-to-teacher ratios over a period of years. Provided with the relevant data, learners create a...
EngageNY
Modeling a Context from Data (part 1)
While creating models from data, pupils make decisions about precision. Exercises are provided that require linear, quadratic, or exponential models based upon the desired precision.
EngageNY
End-of-Module Assessment Task - Algebra 1 (Module 3)
Looking for higher-level thinking questions? This assessment provides questions that challenge young mathematicians to think and analyze rather than simply memorize. Topics include piecewise functions, linear modeling, exponential...
Statistics Education Web
NFL Quarterback Salaries
Use statistics to decide if NFL quarterbacks earn their salaries! Learners study correlation coefficients after using technology to calculate regression equations. Through the data, they learn the meaning of correlation and correlation...
Concord Consortium
Look but Do Not Touch
We seem to keep missing each other. A short task provides pupils with a quadratic function, as well as a linear function with a missing coefficient. They must determine the value of the coefficient for which the graphs do not intersect.
Mathematics Assessment Project
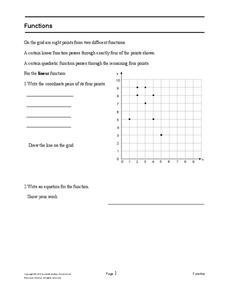
Functions
After identifying which of the given coordinate points fall on the graph of a line and which fall on the graph of a parabola, pupils write equations for each function.
Statistics Education Web
The United States of Obesity
Mississippi has both the highest obesity and poverty rate in the US. Does the rest of the data show a correlation between the poverty and obesity rate in a state? Learners tackle this question as they practice their skills of regression....
EngageNY
End-of-Module Assessment Task - Algebra 2 (Module 1)
A series of assessment tasks require learners to process information and communicate solutions. Topics include graphing parabolas, solving linear-quadratic systems, factoring polynomials, and solving polynomial equations.
Other popular searches
- Graphing Equations of Lines
- Graphing Horizontal Lines
- Graphing Vertical Lines
- Graphing Parallel Lines


