EngageNY
The Graph of the Natural Logarithm Function
If two is company and three's a crowd, then what's e? Scholars observe how changes in the base affect the graph of a logarithmic function. They then graph the natural logarithm function and learn that all logarithmic functions can be...
Illustrative Mathematics
Exploring Sinusoidal Functions
What effect does changing a parameter have on the graph of a trigonometric function? Pupils use a Desmos applet to explore the general sine graph. They experiment changing different parameters and record the resulting change of the...
Illustrative Mathematics
Telling a Story With Graphs
Turn your algebra learners into meteorologists. Students are given three graphs that contain information about the weather in Santa Rosa, California during the month of February, 2012. Graph one shows temperatures, graph two displays the...
West Contra Costa Unified School District
Exploring Quadratics and Graphs
Young mathematicians first graph a series of quadratic equations, and then investigate how various parts of the equation change the graph of the function in a predictable way.
Mathematics Vision Project
Module 3: Features of Functions
Learn how to represent functions in multiple ways. Learners analyze functions as equations, graphs, and verbal descriptions. The analysis includes intercepts, behavior, domain, and range. The module of seven lessons makes up the third...
CPM
How to Recognize the Type of Graph from a Table
Linear, quadratic, and exponential functions are represented only by their table of values in this simple, well-written worksheet. Learners decide the type of graph represented based on the differences in the function values....
Mathematics Vision Project
Module 2: Logarithmic Functions
Build a solid understanding of logarithmic functions and equations. Five lessons in the module begin by developing the concept of a logarithm. The next lessons address graphing logarithmic functions, logarithmic properties, and solving...
Curated OER
Algebra 2 Desmos Graphing Project
Encourage class members to get creative with functions. Pairs write their names and draw pictures using a graphing application with a collaborative graphic project. The resource provides the requirements for the project, as well as a...
Mathed Up!
Drawing Quadratic Graphs
Curve through the points. The resource, created as a review for the General Certificate of Secondary Education Math test, gives scholars the opportunity to refresh their quadratic graphing skills. Pupils fill out function tables to...
CK-12 Foundation
Graphs for Discrete and for Continuous Data: Discrete vs. Continuous Data
Not all data is the same. Using the interactive, pupils compare data represented in two different ways. The learners develop an understanding of the difference between discrete and continuous data and the different ways to represent each...
CK-12 Foundation
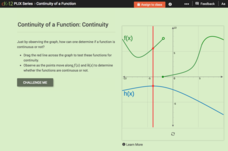
Continuity of a Function: Continuity
Does the point continually move along the graph? Pupils drag a line across two functions to determine whether they are continuous or not. They answer questions about the properties of continuous and discontinuous functions. Using their...
Shodor Education Foundation
Two Variable Function Pump
Use a function to operate on two variables. Pupils look at operating with complex numbers as a function of two variables. The interactive squares the input and adds a constant to it. Learners visualize the resulting output and its...
CK-12 Foundation
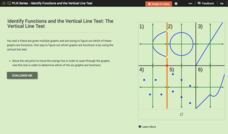
Identify Functions and the Vertical Line Test: The Vertical Line Test
There's no easier test than the vertical line test. Learners drag a vertical line across the graphs of several relations in an interactive. They answer a set of challenge questions that focus on whether the graphs represent functions.
Radford University
Function Family Fun
It's time for a family reunion—function families, that is. Pupils first review different types of parent functions. They then see how to apply transformations to graphs and learn how to select the most appropriate type of function to...
Flipped Math
Modeling with Graphs
Create a graph for anything in the world. Pupils continue to work with graphs that model situations. The learners analyze different graphs to answer questions about the scenario along with finding equations of graphs. Scholars use...
CK-12 Foundation
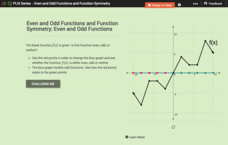
Even and Odd Functions and Function Symmetry: Even and Odd Functions
Even, odd, or neither? Pupils study even and odd functions using a well-balanced interactive. They determine whether a given function is even or odd from its graph.
Curated OER
Graphing Practice
Click on the download box to access this useful graphing lesson that includes worksheets for homework, assessment, and classroom work. The class graphs basic linear functions. They rewrite the equations from standard form into...
Curated OER
Graphing From Function Tables
In this graphing from function tables worksheet, learners graph given functions from a completed function table. This is a worksheet generator, the teacher can set the grid size for plotting points as well as whether or not to include a...
Curated OER
Linear and Exponential Functions
This comprehensive unit on linear and exponential functions provides numerous clearly-written worksheets. Topics include graphing linear equations, solving systems of equations algebraically and by graphing, identifying the domain and...
Curated OER
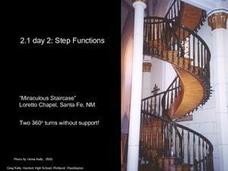
Calculus 2.1 day 2 - Step Functions
"Step functions" are sometimes used to describe real-life situations. This extensive lesson with many practice examples demonstrates two such functions: the Greatest Integer Function and the Least Integer Function. The commands on the...
Illustrative Mathematics
Graphs of Compositions
It might help when working with this resource to give an example of a composition function. For example, the amount of time it takes to get to work depends on the amount of traffic; the amount traffic depends on the time of day....
Curated OER
One to One Functions
In this one to one functions worksheet, students solve 27 short answer and graphing problems. Students determine if a function is one to one given a graph or an equation. Students graph functions to determine if it is one to...
University of Texas
A Library of Parent Functions
Don't think this lesson is for Mom and Dad; parent functions are all for your high schoolers. Flip through a presentation with a focus slide on each type of graph and its characteristics. Some examples are included but the...
Inside Mathematics
Vencent's Graphs
I like algebra, but graphing is where I draw the line! Worksheet includes three multiple-part questions on interpreting and drawing line graphs. It focuses on the abstract where neither axis has numbers written in, though both are...
Other popular searches
- Algebra Graphing Functions
- Exploring Graphing Functions
- Graphing Nonlinear Equations
- Functions and Graphing

