Curated OER
Graphing Stories Ice Breaker
Kick off the school year with some math fun! New classmates share information about themselves by using graphs and interpreting data. The goal is to use a general graph shape, such as linear or exponential, and create labels for the axes...
Curated OER
Design a Green Rooftop Garden
Design and construct buildings with rooftop gardens. Junior engineers work in groups to build two buildings and then perform experiments to determine whether or not a garden affects the building temperatures. They graph and interpret...
Curated OER
Great Graph!
Here is a fantastic lesson counting coins, interpreting graphs, and the concept of "greater than" and "less than." Young mathematicians utilize worksheets embedded in the plan in order to practice these concepts. The worksheets are...
Mathematics Assessment Project
Interpreting Distance–Time Graphs
Pre-algebra protégés critique a graph depicting Tom's trip to the bus stop. They work together to match descriptive cards to distance-time graph cards and data table cards, all of which are provided for you so you can make copies for...
EngageNY
Two Graphing Stories
Can you graph your story? Keep your classes interested by challenging them to graph a scenario and interpret the meaning of an intersection. Be sure they paty attention to the detail of a graph, including intercepts, slope,...
EngageNY
The Graph of a Linear Equation—Horizontal and Vertical Lines
Graph linear equations in standard form with one coefficient equal to zero. The lesson plan reviews graphing lines in standard form and moves to having y-coefficient zero. Pupils determine the orientation of the line and, through a...
Curated OER
Graph It!
There is more than one way to represent data! Learners explore ways to represent data. They examine stacked graphs, histograms, and line plots. They conduct surveys and use stacked graphs, histograms, or line plots to chart the data they...
Curated OER
Function Graphing--ID: 8252
Those graphing calculators can be tricky; good thing Texas Instruments has devised a lesson on how to use their TI-Nspire calculator to graph functions. Kids investigate functional notation as they graph ordered pairs in the form (a,...
Curated OER
Reading Graphs
Working independently or in teams, your class practices connecting graphs, formulas and words. This lesson includes a guided discussion about distance vs. time graphs and looking at how velocity changes over time.
Illustrative Mathematics
Telling a Story With Graphs
Turn your algebra learners into meteorologists. High schoolers are given three graphs that contain information about the weather in Santa Rosa, California during the month of February, 2012. Graph one shows temperatures, graph two...
Curated OER
Position vs. Time Graphs of an Object at Rest
The presentation includes nine time vs. position graphs. The first three are meant to be used for teaching how to read them. The next three provide an opportunity for students to practice reading them, while the last three display the...
Inside Mathematics
Vencent's Graphs
I like algebra, but graphing is where I draw the line! Worksheet includes three multiple-part questions on interpreting and drawing line graphs. It focuses on the abstract where neither axis has numbers written in, though both are...
Virginia Department of Education
Graphing Linear Equations
Combine linear equations and a little creativity to produce a work of art. Math scholars create a design as they graph a list of linear equations. Their project results in a stained glass window pattern that they color.
Kenan Fellows
Using Motion Sensors to Explore Graph Sketching
Get moving to a better understanding of graphs of derivatives. Using motion sensors, scholars vary their velocities to create graphs of the first derivative of a function. The activity challenges groups to first create a script of the...
K12 Reader
Showing Data on a Graph
Here's a worksheet that not only introduces kids to graphing, but also is designed as a reading comprehension activity. After reading the article about graphing, kids respond to a series of questions based on the article.
Bowland
Design the Mascot
Explore how resizing an object affects its area. The set of lessons challenges young mathematicians to design a mascot for electronic devices. These designs undergo resizing to determine how scale factors of dilation affect area.
Curated OER
Graphing the Temperature within the Atmosphere
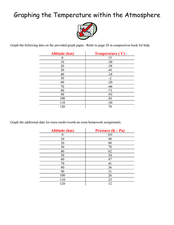
Musing meteorologists design graphs of the temperature and pressure changes for altitude increase in our atmosphere. The activity is pertinent to middle school earth science curriculum. Vary the type of homework you assign when teaching...
Curated OER
Graph Paper Patterns
Young artists divide a piece of graph paper into sections using rectangles, squares, and triangles. They then fill each section with patterns of shape and color. Elementary graders describe how their patterns are organized. Secondary...
Curated OER
Design Your Own Building
Students explore the use of design principles in the real world. They evaluate how problems can be solved using design principles. In groups, students design the floor plan for a building of their choice.
Curated OER
Conversation Heart Graphing
Sixth graders review the different types of graphs (bar, line, pictograph) They predict the data set they can garner several boxes of conversation hearts. Students record their data using an Excel spreadsheet. They create a graph based...
National Math + Science Initative
Using Linear Equations to Define Geometric Solids
Making the transition from two-dimensional shapes to three-dimensional solids can be difficult for many geometry learners. This comprehensive Common Core lesson plan starts with writing and graphing linear equations to define a bounded...
Curated OER
A Picture is Worth a Thousand Words: Introduction to Graphing
Students practice graphing activities. In this graphing lesson plan, students discuss ways to collect data and complete survey activities. Students visit a table and graphs website and then a create a graph website to practice graphing.
Alabama Learning Exchange
I Know What You Did Last Summer: A Data Graphing Project
Young scholars participate in graphing data. In this graphing data lesson, students make a stem and leaf plot of their summer activities. Young scholars create numerous graphs on poster boards. Students discuss the differences between...
Curated OER
Graphs and Functions
Use this series of activities to introduce learners to graphing functions. They graph both linear and quadratic equations by hand and with a Graph Sketcher Tool. Several imbedded links and handouts are included in the lesson plan.


