Curated OER
Graphs to Represent a Data Set
By analyzing a word problem about hours worked in a week, scholars get valuable practice with bar graphs and data analysis. They read the scenario, then examine a table of data taken from it. The data includes four days and the...
Curated OER
Graphs to Represent a Data Set
Here are Jack's hours for the week; scholars organize them into a bar graph in this data analysis worksheet. They write the days along the y-axis and hours along the x-axis. Encourage labeling for this. Consider projecting as an...
Curated OER
Finding the Limit: Piecewise Functions and Graphs
This pre-calculus worksheet is short, yet challenging. High schoolers calculate the limit of piecewise functions, rational functions, and graphs as x approaches a number from the positive or negative side. There are four questions.
Curated OER
Wacky Water World: Student Worksheet
This well-designed math worksheet invites learners to work in pairs in order to determine which plan is the better value when going to an amusement park. Plan A and Plan B each have different admission fees, and different rates per ride....
EngageNY
Modeling a Context from Data (part 2)
Forgive me, I regress. Building upon previous modeling activities, the class examines models using the regression function on a graphing calculator. They use the modeling process to interpret the context and to make predictions based...
Virginia Department of Education
Transformational Graphing
Find relationships between the structure of a function and its graph. An engaging lesson explores seven parent functions and their graphs. Learners match functions to their graphs and describe transformations.
Virginia Department of Education
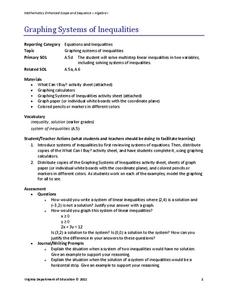
Graphing Systems of Inequalities
Apply systems of inequalities to a real-world problem. Here, scholars learn to graph solutions to systems of linear inequalities. To finish the lesson plan, they solve a problem involving burgers and cheeseburgers using a system of...
Curated OER
Hitting the Slopes (Using the Graphing Calculator)
In this slope worksheet, students use graphing calculators to determine the slope of a line. They graph lines and identify characteristics of positive and negative slopes. This two-page worksheet contains four multi-step problems.
Illustrative Mathematics
Graphs of Quadratic Functions
The equations look different, but their graphs are the same. How can that be? This activity leads your mathematicians in an exploration of three different forms of the same quadratic function. After comparing the equations, their graphs,...
Balanced Assessment
Cost of Living
Math scholars investigate the cost of living in Hong Kong compared to Chicago but must first convert the different types of currency. They then choose a type of graph to compare different spending categories and finish the activity by...
SHS Algebra
Transformations of Linear and Exponential Graphs
Your transformers will create and analyze graphs to discover which operations produce which transformations. Linear and exponential functions are used to model the transformations.
Willow Tree
Line Graphs
Some data just doesn't follow a straight path. Learners use line graphs to represent data that changes over time. They use the graphs to analyze the data and make conclusions.
EngageNY
The Line Joining Two Distinct Points of the Graph y=mx+b Has Slope m
Investigate the relationship between the slope-intercept form and the slope of the graph. The lesson plan leads an investigation of the slope-intercept equation of a line and its slope. Pupils realize the slope is the same as the...
Flipped Math
Unit 5 Review: Systems of Equations
Activate transformers along with algebra systems. Pupils use 10 problems to review transformations of functions to solve a variety of systems of equations. Individuals identify the types of transformations from an equation along with...
Curated OER
Three Methods for Using Quadratic Functions to Model Data
In this modeling data learning exercise, students use quadratic functions to model data using three different methods. This learning exercise provides explanations and an example. Additionally, students are given the steps to find the...
Saxon
Plotting Functions
Youngsters use a graphing calculator to assist in creating a function table. They graph the function on a coordinate plane. They explore the relationship between the domain and range in the graph. This four-page worksheet contains two...
Concord Consortium
Crossing the Axis
Mathematicians typically reference eight different types of functions. Scholars learn about the requirements for graphing a function and must decide how many different functions fit. To finish, they define each specific function meeting...
Flipped Math
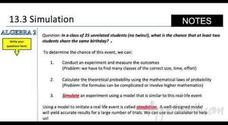
Simulations
Simulate an exciting graphing calculator-based lesson. Individuals watch and participate creating simulations using the random number generator in a graphing calculator to answer probability problems. Learners then build simulations to...
Math Worksheets Land
Pie or Circle Graphs—Step-by-Step Lesson
How do you display data that you've collected in a pie chart? Follow a clear step-by-step guide to turning survey results into a visible format. It shows kids how to determine the percentage of the whole that each section represents.
Curated OER
Senior Analysis: Graphing Rational Functions
Budding mathematicians graph given functions, identify the asymptotes, graph absolute values, and write a table of points. This three-page worksheet contains 23 problems.
Illustrative Mathematics
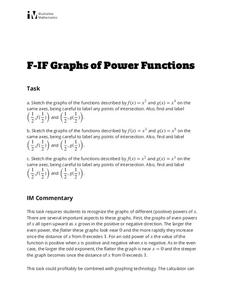
Graphs of Power Functions
This activity consists of three exercises in which learners sketch the graphs of various power functions on the same axes. They use their sketches to make comparisons and observations which lead to generalizations about the graphs of...
Curated OER
Graphing Linear Equations Cards
OK, so maybe graphing linear equations can be fun. This activity includes a set of linear equation cards to be cut and place face up on a table. Learners pick a card and match it to the correct graph card. This is a really fun way to...
Curated OER
Algebra II Calculator Lab
In this quadratic functions activity, students use their graphing calculators to solve the 9 problems on the page. The questions ask students to graph functions, compare graphs, find the vertex and axis of symmetry and more.
Teach Engineering
Matching the Motion
It is not always easy to walk the straight and narrow. In the sixth portion of a nine-part unit, groups actively recreate a graph depicting motion. Individuals walk toward or away from a motion detector while trying to match a given...
Other popular searches
- Graphing Calculator and Math
- Algebra Graphing Calculators
- Graphing Calculator Math
- Graphing Calculator Skills
- Graphing Calculator Squares
- Graphing Calculator Lessons
- Graphing Calculator Parabola
- Graphing Calculators Ti 83
- Graphing Calculator Activities
- Graphing Calculator Worksheet
- Ti 84 Graphing Calculator


