Curated OER
Pythagorean Theorem by Graphic Manipulation
There are many different ways to show a proof of the Pythagorean Theorem. Here is a nice hands-on paper cutting activity that shows a graphic representation. You can even challenge your young Pythagoreans to come up with their own...
EngageNY
Connecting Graphical Representations and Numerical Summaries
Which graph belongs to which summary statistics? Class members build upon their knowledge of data displays and numerical summaries to connect the two. Pupils make connections between different graphical displays of the same data in the...
Beyond Benign
Decision Graphic Introduction
E is for economics, environment, and social equity. The fifth installment of a 15-part series has scholars first considering ecological impacts, such as determining how much water it takes to produce a can of soda. They then use decision...
Concord Consortium
Graphical Depictions
Parent functions and their combinations create unique graphical designs. Learners explore these relationships with a progressive approach. Beginning with linear equations and inequalities and progressing to more complex functions,...
West Contra Costa Unified School District
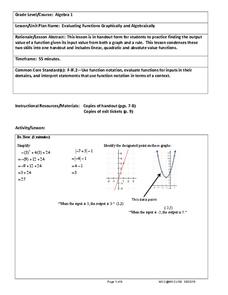
Evaluating Functions Graphically and Algebraically
High schoolers evaluate functions graphically and algebraically. After completing that step, they write a statement describing the input and output.
Curated OER
The Power of Graphical Display: How to Use Graphs to Justify a Position, Prove a Point, or Mislead the Viewer
Analyze different types of graphs with learners. They conduct a survey and determine the mean, median and mode. They then identify different techniques for collecting data.
Curated OER
Graphical Analysis
Get out your TI-nspire graphing calculator and explore polynomials. Learners determine where a given polynomial are increasing or decreasing, find maximums, minimums, and zeros of polynomials, and discuss end behavior of polynomials....
Blogger
Order of Operations Foldable and Graphic Organizer
A 2-for-1 printable that includes a graphic organizer and foldable activity practicing the order of operations. Print out the hopscotch organizer that stacks multiplication with division and addition with subtraction so learners remember...
Curated OER
Integers - Graphical Representation
In this integers of graphical representation instructional activity, 7th graders solve 23 various types of problems that include graphing on a number line and writing an integer to represent each statement given. Then they write an...
Curated OER
Multiple Use Flower Power Graphic Organizer
In this multiple use flower power graphic organizer worksheet, students use a flower shaped black line picture in a number of ways. They put a picture in the middle circle and place describing words in the petals. They place a prefix or...
Concord Consortium
Graphing Elements
How do you graph a sentence? Scholars do just that as they represent relationships between independent and dependent variables with a graphical representation. Given a sentence, they determine the pertinent relationship and create a...
Mathematics Assessment Project
Representing Quadratic Functions Graphically
Sometimes being different is an advantage. An engaging activity has scholars match cards with quadratic functions in various forms. Along the way, they learn about how each form highlights key features of quadratic functions.
Charleston School District
Solving Systems Graphically
When guess and check gets old, it's time to start graphing! An instructive lesson explains how to solve a system of linear equations using graphing. Equations are in both slope-intercepts and standard form.
Texas Instruments
Factoring and Solving Quadratic Binomials
Here is a TI-Navigator™ activity that allows learners to review the concept of factoring and solving quadratic binomials, including a connection to graphical solutions. They enter a number such as -2 using the minus key and not the...
Curated OER
Linear Systems: Graphical Interpretation of Vectors
In this graphical interpretation of vectors worksheet, students explore the geometrical appearance of given problems, determine if vector subtraction is commutative and graph a system of equations. This three-page worksheet contains...
Curated OER
Event Graphic Organizer
In this event graphic organizer worksheet, students identify an event, record details, list prior knowledge, make inferences, and make a conclusion.
PBS
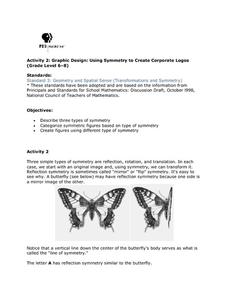
Using Symmetry to Create Corporate Logos
Young mathematicians investigate the use of symmetry in graphic design. After first learning about reflection, translational, and rotational symmetry, children use this new knowledge to identify symmetry in letters of the alphabet and...
Curated OER
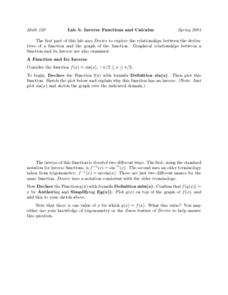
Lab 5: Inverse Functions and Calculus
Learners identify graphical relationships between a function and its inverse using a graphing calculator. They begin by declaring the function f(x) with formula definition sin(x), then plot this function. To finishing the lab, they check...
Curated OER
Venn Diagrams
The Venn diagram is an important graphic organizer, and learners should be familiar with it. Here, pupils compare things that are made of plastic and metal, and they identify the things that have both substances in them. There are two...
Curated OER
Translating Digital Graphics
In this technology learning exercise, learners translate digital graphics using prime numbers. They rewrite the codes as sentences. There are 4 transmissions to be decoded with some hints.
Intensive Intervention
Fractions as Numbers
Your learners will enjoy thoroughly understanding fractions, and you will appreciate the abundant, quality resources in this comprehensive unit that builds toward a complete understanding of the concept of fractions as numbers. Many...
Modesto Junior College
Graphical Transformations of Functions
Transform your knowledge from average to excellent with this comprehensive guide to function transformations. All of the types of shifts, stretches, and reflections are included with an explanation and coordinating graph to show...
Worksheet Fun
Fractions, Decimals and Percents #1
Grasp conversion with these excellent fraction, decimal, and percent worksheets that have a graphic model of place value. Mathematicians will grasp the concept in no time.
Curriculum Corner
Order of Operations Task Cards (2)
Young mathematicians use their PEMDAS knowledge to solve 20 different task cards. They evaluate expressions to find the answer of multiplication, division, addition, subtraction, and exponential problems. Then, they record their answers...
Other popular searches
- Graphic Organizers
- Graphic Design
- Biography Graphic Organizer
- Main Idea Graphic Organizers
- Vocabulary Graphic Organizer
- Story Map Graphic Organizer
- Graphic Aids
- Science Graphic Organizers
- Setting Graphic Organizer
- Math Graphic Organizers
- 4 Square Graphic Organizer
- Sample Graphic Organizers


