Curated OER
Using a Graphic Organizer to Research a Question
Is Pluto still a planet? Using this popular question, kids are introduced to graphic organizers as a writing tool. As a class, they watch a demonstration on how to use them and work together with a partner to research whether Pluto is a...
Beyond Benign
Decision Graphic Introduction
E is for economics, environment, and social equity. The fifth installment of a 15-part series has scholars first considering ecological impacts, such as determining how much water it takes to produce a can of soda. They then use decision...
Bowels Physics
Graphical Analysis
Assist your class in learning graphical analysis by reviewing the slide presentation. Class members review 15 slides to further understand concepts such as velocity and acceleration. They conclude with practice problems related to the...
Curated OER
Web Graphic Organizer
In this science/Arctic worksheet, students utilize a graphic organizer to plan out their Arctic report/project by placing key words on each line to help them organize their thoughts.
National Wildlife Federation
Gator Hole Graphics
Climate changes are cyclic so how do these changes impact species that live in different habitats? Learners examine the rainfall levels in a specific swamp habitat. They also review graphical data and tell a story about how the...
Chicago Botanic Garden
Causes and Effects of Climate Change
It's time for your class to literally show what they know! Pupils illustrate what they learned about the causes and effects of climate change by filling out a graphic organizer to complete the 5-part series of lessons. They discuss them...
US Geological Survey
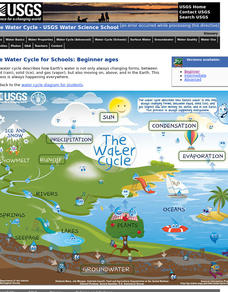
The Water Cycle for Schools: Beginner Ages
Explore a day in the life of a water droplet. An interactive infographic helps scholars learn how water cycles work from precipitation all the way around to condensation. Learners hover over each step of the cycle to read more as they...
Curated OER
Note Taker - Graphic Organizer
In this graphic organizer worksheet, student take notes using a graphic organizer that identifies the topic and source in the middle of the page. They fill in boxes with information about events, people, key terms, and facts. They write...
Curated OER
Episode Graphic Organizer
In this episode graphic organizer, learners organize a large body of information about specific events. This information includes; time and place, specific people or events, specific duration, event's particular cause and effect.
Curated OER
Graphic Organizer
In this graphic organizer worksheet, students record information that they learn in a lesson by including it in the important information, interesting details, or my thinking column.
Curated OER
Event Graphic Organizer
In this event graphic organizer worksheet, students identify an event, record details, list prior knowledge, make inferences, and make a conclusion.
Curated OER
Reading Comprehension: History of the Periodic Table
Although the article that launches this lesson is about the history of the Periodic Table, the objective is reading comprehension. Using the eight-page informational text, learners answer five comprehension questions and craft one essay....
Curated OER
Graphics Creation and Statistical Interpretation: Relating Local Economics and the Global Environment
Students apply statistics, and graphical interpretation to economics, the environment and populations. In this statistical lesson students construct graphical displays and classify data.
Curated OER
Simple Machines - Graphics, Experiments, Animation
Twelfth graders display simple machines through the use of graphics, experiments, and animation. They apply problem solving and design and skills.
Have Fun Teaching
The State of Things
Is it a solid, liquid. or gas? Cut out these graphics for a fun manipulative game that has kids sorting everyday items into their states of matter. They complete three worksheets referencing the sorting activity.
Curated OER
Youth Emergency Preparedness
What is an emergency, why is preparing for one important, and how can your pupils help others prepare for an emergency? Answer these questions and more with a short unit. Learners will participate in a variety of collaborative,...
Curated OER
Science Current Event Graphic Organizer
In this current events learning exercise, students fill in details on a graphic organizer from a current event. They include the title of the article, the author, the source, and the date. They fill in boxes about "who", "what", "where",...
Chicago Botanic Garden
Review and Assessment: Causes and Effects of Climate Changes
The last activity in the series of five is a short one where individuals show what they've learned about the causes and effects of climate change. Working independently, they fill in a graphic organizer, then compare their notes with a...
Curated OER
Unit III: Worksheet 2 - Motion Maps
Make motion maps, draw graphical representations, and determine displacement. These are the activities included in this physics assignment. This is a great review of velocity, position, acceleration, and displacement concepts.
Curated OER
Fact or Opinion Graphic Organizer
In this graphic organizer worksheet, students read the difference between a fact and an opinion. They identify a topic and write facts or opinions in the chart to help them organize their thoughts and information.
Curated OER
Compare and Contrast Graphic Organizer
In this graphic organizer, students compare and contrast land animals and sea animals. They make a list of how they are different, and another list of how they are different after looking at photographs on the page.
Curated OER
Brainstorming and Creating a Graphic Organizer Using Kidspiration
Although focused on the winter ecology at Crater Lake, this lesson could be tweaked to use as a exploration of any region. After a visit to Crater Lake, learners discuss topics relating to winter in this area, such as the behavior of...
Curated OER
Nutritional Relationships Chart
Producers, Herbivores, Carnivores, Decomposers, oh my! Help organize the intricacies between these four types of eaters with this biology worksheet. Scientists display nutritional relationships in a graphic organizer. They place 15 terms...
Curated OER
Dear Peter Rabbit
Write dear old Peter Rabbit a letter with this lesson. First, youngsters listen to the story Peter Rabbit and analyze the story elements. Then they complete a story map graphic organizer in order to write a letter to Peter...
Other popular searches
- Graphic Organizers
- Graphic Design
- Biography Graphic Organizer
- Main Idea Graphic Organizers
- Vocabulary Graphic Organizer
- Story Map Graphic Organizer
- Graphic Aids
- Science Graphic Organizers
- Setting Graphic Organizer
- Math Graphic Organizers
- 4 Square Graphic Organizer
- Sample Graphic Organizers


