Inside Mathematics
Vencent's Graphs
I like algebra, but graphing is where I draw the line! Worksheet includes three multiple-part questions on interpreting and drawing line graphs. It focuses on the abstract where neither axis has numbers written in, though both are...
Balanced Assessment
Movie Survey
Movie preferences will get your classes talking! Individuals read a pie graph and construct a bar graph using the same information. They then answer questions specific to the data and sample size.
Inside Mathematics
Sorting Functions
Graph A goes with equation C, but table B. The short assessment task requires class members to match graphs with their corresponding tables, equations, and verbalized rules. Pupils then provide explanations on the process they used to...
EngageNY
Geometric Interpretations of the Solutions of a Linear System
An intersection is more than just the point where lines intersect; explain this and the meaning of the intersection to your class. The 26th segment in a 33-part series uses graphing to solve systems of equations. Pupils graph linear...
Inside Mathematics
Party
Thirty at the party won't cost any more than twenty-five. The assessment task provides a scenario for the cost of a party where the initial fee covers a given number of guests. The class determines the cost for specific numbers of guests...
Mathed Up!
Inequalities Regions
Discover how to solve systems of inequalities by graphing. An informative video shows pupils how to determine the solution set after graphing each inequality of a system. To finish, a worksheet gives them a chance to practice this skill.
EngageNY
End-of-Module Assessment Task - Algebra 1 (Module 4)
Critical thinking is an important aspect of mathematics — it's time to put your brain to work! Use this assessment to challenge pupils and test their skills. Concepts assessed include function notation, factoring, completing the square,...
Los Angeles County Office of Education
Assessment for the California Mathematics Standards Grade 2
Test scholars mathematic skills with an assessment addressing addition, subtraction, multiplication, place value, measurement, geometric shapes, expanded notation; and their ability to compare numbers, write number...
Balanced Assessment
Vacation in Bramilia
This performance task gives the population model of different types of flies and asks scholars to analyze the two populations. After interpreting the functions individually, participants compare the two populations and find the time...
Mathematics Assessment Project
Middle School Mathematics Test 3
Real-life mathematics is not as simple as repeating a set of steps; pupils must mentally go through a process to come to their conclusions. Teach learners to read, analyze, and create a plan for solving a problem situation. The...
Inside Mathematics
Quadratic (2006)
Most problems can be solved using more than one method. A worksheet includes just nine questions but many more ways to solve each. Scholars must graph, solve, and justify quadratic problems.
Inside Mathematics
Population
Population density, it is not all that it is plotted to be. Pupils analyze a scatter plot of population versus area for some of the states in the US. The class members respond to eight questions about the graph, specific points and...
Inside Mathematics
Scatter Diagram
It is positive that how one performs on the first test relates to their performance on the second test. The three-question assessment has class members read and analyze a scatter plot of test scores. They must determine whether...
Concord Consortium
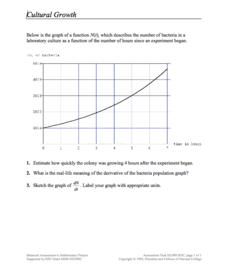
Cultural Growth
Scholars read and interpret a graph relating bacterial growth in a culture over time. They apply knowledge of derivatives, estimation, and graphing to the skill practice questions.
Illustrative Mathematics
Downhill
A car traveling down a steep hill is the model for this resource. The confusion comes when the elevation, E, is given in terms of distance, d. The distance, d, is the horizontal distance from E. Therefore, the equation, E = 7500 – 250d,...
Mathed Up!
Histograms
Class members explore how to read and use histograms by watching a video on creating and analyzing histograms. To finish, the class works on a set of questions that tests these skills.
Mathed Up!
Frequency Polygons
Frequency polygons are a different way to represent frequencies over intervals. Pupils take frequencies for intervals of data from a frequency table and plot them as a frequency polygon. Budding mathematicians find information about the...
Curated OER
2008 U.S. National Chemistry Olympiad Part I
In this chemistry Olympiad learning exercise, students solve sixty multiple choice questions on a variety of chemistry topics from finding molarity of solutions to calculating products of reactions. Students are given graphs, equations,...
EngageNY
Summarizing a Distribution Using a Box Plot
Place the data in a box. Pupils experiment with placing dividers within a data set and discover a need for a systematic method to group the data. The 14th instructional activity in a series of 22 outlines the procedure for making a...
Bridges In Mathematics
Grade 2 Comprehensive Growth Assessment
Need to know if your students comprehend all the Common Core standards covered in second grade? This growth assessment will let you know. Find out if your second graders can add/subtract, tell the time, read a bar graph, know their...
Illustrative Mathematics
Warming and Cooling
Is it too hot to go hiking? This task asks learners to refer to a graph that shows temperature as a function of time and answer five questions about the scenario depicted by the graph. The exercise could be used for instruction to help...
Mathed Up!
Pie Charts
Representing data is as easy as pie. Class members construct pie charts given a frequency table. Individuals then determine the size of the angles needed for each sector and interpret the size of sectors within the context of frequency....
Noyce Foundation
Ducklings
The class gets their mean and median all in a row with an assessment task that uses a population of ducklings to work with data displays and measures of central tendency. Pupils create a frequency chart and calculate the mean and median....
Inside Mathematics
Rhombuses
Just what does it take to show two rhombuses are similar? The assessment task asks pupils to develop an argument to show that given quadrilaterals are rhombuses. Class members also use their knowledge of similar triangles to show two...


