Curated OER
Graphing Linear Equations Using a Table of Values
Students explore the concept of linear equations. In this linear equations worksheet, students graph linear equations using tables of values. Students graph 16 linear equations.
Curated OER
Line Graphs
Let's take a look at Luis' bike ride! Scholars examine a line graph charting a 20-kilometer bike ride over the course of six hours. They answer six questions about the data requiring the understand the concepts of each axis and the line...
Illustrative Mathematics
Weather Graph Data
Teaching young mathematicians about collecting and analyzing data allows for a variety of fun and engaging activities. Here, children observe the weather every day for a month, recording their observations in the form of a bar graph....
Curated OER
Worksheet 4: Graphs and One-Sided Limits
In this math worksheet, students answer 6 questions regarding functions, graphs, one-sided limits, intercepts, vehicle speed and wheel rotation.
Curated OER
Graphing Ordered Pairs
Are you working on graphing ordered pairs in your class? For this worksheet, learners, after looking over and studying how to graph ordered pairs, plot points on a coordinate grid and connect the dots. Class members also identify what...
Curated OER
Easter Graphing Fun
Graphing can be festive! This Easter worksheet has scholars using coordinates to record the location of ten holiday images. The first is done for them, and the grid is large and appealing to younger learners. Consider visualizing this...
Curated OER
2D-Graphing Functions
Practice graphing basic equations. Algebra learners complete a table showing values of x and y. They graph the results on a coordinate grid. There are six problems: three equations are linear, and three are quadratic. The "show your...
Curated OER
Worksheet 2: Graphs, Functions and Derivatives
In this math worksheet, students answer 7 questions having to do with graphing derivatives of functions, rectilinear motion, speed and distance.
Curated OER
Complete the Graphs
First, second, and third graders make pictographs. There are four graphs to complete, and the answer sheet is included. Consider providing your learners with special needs two sets of stickers to use, instead of requiring them to draw...
Curated OER
Graphing Linear Equations
In this graphing linear equations worksheet, students plot 22 lines on their coordinate grids. When directions are followed carefully, the result is a picture.
Curated OER
Picture Graphs
An innovative way to practice reading data, as well as the four operations! Three picture graphs prompt first graders to count marbles, books, and pets. They also solve addition and subtraction problems. Additionally, they work on...
Curated OER
Graphs of Functions
Students explore the concept of quadratic equations. For this quadratic equations worksheet, students are given the parent graph y=x^2 and must determine the equations of two quadratic equations that have been shifted.
Google
Graphing with Google Docs & Forms
Get to know your class and teach about data analysis all with the help of Google Docs. Using student-generated questions, create a class survey using Google Forms. Reserve time in the computer lab for learners to complete the form and,...
Illustrative Mathematics
Telling a Story With Graphs
Turn your algebra learners into meteorologists. High schoolers are given three graphs that contain information about the weather in Santa Rosa, California during the month of February, 2012. Graph one shows temperatures, graph two...
Flipped Math
Modeling with Graphs
Create a graph for anything in the world. Pupils continue to work with graphs that model situations. The learners analyze different graphs to answer questions about the scenario along with finding equations of graphs. Scholars use...
Curated OER
Graphing Lines That Don't "Fit"
How can you graph lines that don't seem to fit on the given graph? What makes a line straight? What does the rate of change mean when graphing a line? How do you know if a slope is positive or negative? How do you know if the graph of a...
CCSS Math Activities
Vincent’s Graphs
What in the world are they doing? Given two graphs, scholars interpret the graphs and connect them to a real-world situation. They must also draw a graph given information about a context.
Mathed Up!
Drawing Quadratic Graphs
Curve through the points. The resource, created as a review for the General Certificate of Secondary Education Math test, gives scholars the opportunity to refresh their quadratic graphing skills. Pupils fill out function tables to find...
Flipped Math
Graphs of Functions
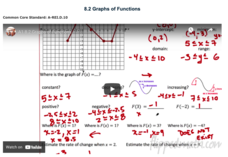
Create a graphical description. Pupils watch a video presentation starting with vocabulary on properties of a graph of a function and then use the vocabulary to find key features of graphs of a function. Scholars use three graphs in the...
Curated OER
Graphing Practice
Click on the download box to access this useful graphing lesson that includes worksheets for homework, assessment, and classroom work. The class graphs basic linear functions. They rewrite the equations from standard form into...
CK-12 Foundation
Line Graphs to Display Data Over Time: Strawberry Competition
Take the tediousness out of graphing. Using the interactive tool, learners can efficiently create a line graph from a set of data. They then use the graph to answer questions about specific trends in the data.
CK-12 Foundation
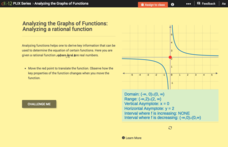
Analyzing the Graphs of Functions: Analyzing a Rational Function
Shift the function and transform the key features of the graph. By translating the graph of the rational function, class members find out how the key features alter. Pupils determine the domain, range, asymptotes, and intervals of...
Houghton Mifflin Harcourt
Graphs from Patterns
Fifth graders analyze patterns and begin looking at function tables. This is a pertinent preparation for graphing patterns. In fact, consider giving your class a piece of graph paper and then teach them how!
Virginia Department of Education
Graphing Linear Equations
Combine linear equations and a little creativity to produce a work of art. Math scholars create a design as they graph a list of linear equations. Their project results in a stained glass window pattern that they color.
Other popular searches
- Coordinate Graphing Pictures
- Charts and Graphs
- Graphic
- Graphic Organizers
- Graphing Ordered Pairs
- Bar Graphs
- Circle Graph
- Vertex Edge Graph
- Graphing Skills Lesson Plans
- Graphic Design
- Line Graphs
- Double Bar Graph


