Curated OER
Graphing the Population Explosion of Weeds
Learners are introduced to the seed cycle and draw the specific steps. In groups, they identify the human barriers to the spreading of weeds. After calculating the rate of spreading of the Yellowstar Thistle, they create graphs to see a...
Curated OER
Murder in the First Degree - The Death of Mr. Spud
Secondary learners investigate exponential functions in a real-world scenario. They collect data on the temperature of a cooling baked potato, enter the data into lists, and graph the data using a scatter plot before finding an...
CK-12 Foundation
Limiting Factors to Population Growth: Graphing Population Growth
If any of the limiting factors in an environment change, both animal and plant populations also change. The video explains two different models of growth and the impact of limiting factors. It highlights the carrying capacity of an...
Curated OER
Exponential Decay
Students study exponential decay and its application to radiocarbon dating. In this exponential decay lesson, students use candy to model the time it takes for something to decay. Students also graph the data they collect and...
National Research Center for Career and Technical Education
Hospitality and Tourism 1: Safety and Sanitation
Math and science come alive in this career-related instructional activity on sanitation. Along the way, learners explore bacterial growth rates using exponential notation and graphs. A link to a very brief, but vivid video shows just how...
Curated OER
Newton's Law of Cooling
Your Algebra learners analyze and solve an exponential equation in this popular, real-life model of the cooling of a liquid.
Institute of Electrical and Electronics Engineers
Get Connected with Ohm's Law
Ideal for your electricity unit, especially with middle schoolers, this lesson plan gets engineers using multimeters in electrical circuits to explore the relationships among voltage, current, and resistance. Older learners may even plot...
National Museum of Nuclear Science & History
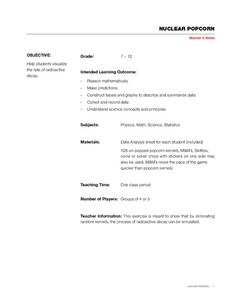
Nuclear Popcorn
Make your lesson on radioactive decay pop with this lab exercise. Using popcorn kernels spread over a tabletop, participants pick up all of those that point toward the back of the room, that is, those that represent decayed atoms. As the...
Curated OER
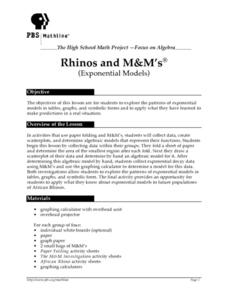
Rhinos and M&M's
High schoolers analyze patterns of exponential models by collecting data in paper folding and M&M investigations. They use graphing calculators to create scatter plots that lead to equations for the exponential models. They then...
Curated OER
Some Similarities between the Spread of an Infectious Disease and Population Growth
If the infectious diseases and population growth instructional activity, students simulate the spread of an infectious disease by exchanging fluids in a lab activity. Students watch the spread of the disease and graph the spread of the...
Curated OER
Human Population Growth
In this human population growth worksheet, students create a graph of human population growth and predict future growth using the data given in a chart. Students identify factors that affect population growth.
Beyond Benign
The Big Melt: Arctic Ice Caps
Are the Arctic ice caps really melting out of existence? Junior climatologists examine the statistics of ice decline through four math-based lessons. Each activity incorporates data, climate information, and environmental impact into an...
Kenan Fellows
Half-Life
Scholars shake their way to understanding half-life with the help of candy. They observe and record which side candy lands on to graph the exponential decay in the fifth instructional activity of seven integrating chemistry and algebra....
Science Matters
Richter Scale
The 12th instructional activity in a series of 20 opens with a demonstration of exponential functions using pasta. This concept is connected to the Richter Scale, which is also an exponential function. Scholars compare the exponential...
Virginia Department of Education
Determining Absolute Age
How can radioactive decay help date old objects? Learners explore half-life and radioactive decay by conducting an experiment using pennies to represent atoms. Young scientists graph data from the experiment to identify radioactive decay...
Chemistry Collective
Chemical Potential: Staircase Demonstration
It's all uphill from here! Scholars examine the pattern of random particle motion up a staircase. The simulation shows how the linear increase in energy corresponds to an exponential decrease in particle concentration.
Curated OER
Population Biology
In this population worksheet, students will compare two graphs; one graph representing steady rate of growth and the other one showing exponential growth. Students will use these graphs to complete 3 short answer questions.
Curated OER
Population Patterns
High schoolers study patterns of population growth in an ecosystem and why populations must remain in balance. They interpret basic population graphs and suggest scenarios about different population growth patterns in an ecosystem.
Curated OER
Scientific Notation III: Linear vs Exponential
Students examine the differences in exponential growth and linear growth of a system. They interpret data on graphs and develop their own charts. They answer discussion questions as well.
Kenan Fellows
Density
Most scholars associate density with floating, but how do scientists determine the exact density of an unknown liquid? The third lesson in a seven-part series challenges scholars to find the mass and volume of two unknown liquids. Each...
Curated OER
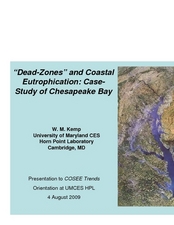
"Dead-Zones" and Coastal Eutrophication: Case-Study of Chesapeake Bay
Take an in-depth look at nutrient loading, eutrophication, and hypoxia using data on The Chesapeake Bay as an example. This comprehensive presentation includes detailed graphs, photos, and details about the changes in marine organism...
CK-12 Foundation
Radiocarbon Dating
How do we know how long ago a dinosaur lived or an ancient fire pit was used? Scholars learn about the application of carbon dating and half lives to discover things about the past. They adjust the amount of radioactive carbon in the...
Curated OER
Introduction to Graphical Representation of Data Sets in Connection to Cellular Growth
Students practice graphing relationships between variables by studying topics such as exponential growth and decay. They conduct a series of numerical experiments using a computer model and a variety of physical experiments using mold,...
Curated OER
What "Ohm's" You?
Students use the CBL and voltage probe to observe electricity. In this algebra lesson plan, students use the TI calculator with the CBL to explore Ohm's Law. They discuss exponential equations and how it relates to Ohm's Law.


