College Board
2006 AP® Statistics Free-Response Questions
Catapult the class into the test. Released items from the free-response section of the 2006 AP® Statistics exam ask individuals to use statistics to figure out the best catapult for determining the accuracy of thermometers. The six...
US Department of Commerce
Sample Means - Exploring Sampling Variability
Sample an excellent resource on sampling variability. Pupils analyze census data on the percentage of homes in each state that have Internet access. They take random samples of different sample sizes, determine the sample means, and then...
American Statistical Association
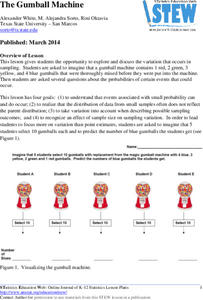
The Gumball Machine
Chew on an activity for probability. Given information on the number of gumballs in a gumball machine, scholars consider how likely it is to randomly draw a blue gumball and how many of each color they would draw in 10 trials if the...
Curated OER
Scatterplots and Regressions
In this scatterplots and regressions worksheet, students solve 6 different types of problems related to graphing scatterplots and interpreting regressions. First, they create a scatterplot from the given data coordinates and then,...
Curated OER
Connect the Mathematical Dots
Teachers can choose visual activities that demonstrate the elegance associated with the coordinate plane.
Statistics Education Web
The United States of Obesity
Mississippi has both the highest obesity and poverty rate in the US. Does the rest of the data show a correlation between the poverty and obesity rate in a state? Learners tackle this question as they practice their skills of regression....
Statistics Education Web
Sampling in Archaeology
Compare different random sampling types using an archaeological setting. Scholars collect data from an archaeological plot using simple random samples, stratified random samples, systematic random samples, and cluster random samples....
Illustrative Mathematics
Heads or Tails
Heads! A great way to practice probability is to flip a coin in class. The provided data allows your mathematicians to predict the probability of heads in ten coin flips. Bring coins to class and allow your own trial of heads or tails....
Curated OER
Histograms and Statistical Graphics
In this statistics worksheet, students solve 6 data problems. They construct a histogram of given data, they create a frequency polygon, and a stem and leaf diagram. Students create a dot plot and a pie chart for given data sets. On the...
West Contra Costa Unified School District
Comparing Data Displays
There is so much more to data than just numbers, and this resource has learners use three methods of comparing data in a multi-faceted lesson. The 21-page packet includes a warm-up, examples, an activity, and assessment for a complete...
EngageNY
Interpreting the Standard Deviation
Does standard deviation work for non-symmetrical distributions, and what does it mean? Through the use of examples, high schoolers determine the standard deviation of a variety of distributions and interpret its meaning. Problems require...
Virginia Department of Education
Absolute Value
Your birthday can be more than just about presents; it can even teach about absolute value. The class investigates absolute value as the distance from zero on a number line. Plotting birth months and comparing each birth month to July...
EduGAINs
Data Management
Using a carousel activity, class members gain an understanding of the idea of inferences by using pictures then connecting them to mathematics. Groups discuss their individual problems prior to sharing them with the entire class. The...
EngageNY
Using Sample Data to Compare the Means of Two or More Populations II
The 23rd segment in a series of 25 presents random samples from two populations to determine whether there is a difference. Groups determine whether they believe there is a difference between the two populations and later use an...
EngageNY
The Mean Absolute Deviation (MAD)
Is there a way to measure variability? The ninth resource in a series of 22 introduces mean absolute deviation, a measure of variability. Pupils learn how to determine the measure based upon its name, then they use the mean absolute...
Curated OER
Coordinate Plotting: Shapes
In this math activity, students graph ordered pairs on a coordinate grid. They connect the points to create a geometric shape. This activity generator allows teachers to select the size of the grid, the complexity of the shapes, and if...
EngageNY
Mid-Module Assessment Task - Algebra 1 (module 2)
A mid-module assessment uses two multi-part questions to measure progress toward mastery on descriptive statistics standards. Each part of a question addresses a single standard to help determine mastery.
EngageNY
Distributions and Their Shapes
What can we find out about the data from the way it is shaped? Looking at displays that are familiar from previous grades, the class forms meaningful conjectures based upon the context of the data. The introductory lesson to descriptive...
American Statistical Association
Colors Challenge!
Does writing the name of a color in a different colored ink affect one's ability to read it? Scholars design an experiment to answer this question. They collect the data, analyze the statistics, and draw a conclusion based on what they...
Statistics Education Web
Are Female Hurricanes Deadlier than Male Hurricanes?
The battle of the sexes? Scholars first examine data on hurricane-related deaths and create graphical displays. They then use the data and displays to consider whether hurricanes with female names result in more deaths than hurricanes...
EngageNY
Measuring Variability for Skewed Distributions (Interquartile Range)
Should the standard deviation be used for all distributions? Pupils know that the median is a better description of the center for skewed distributions; therefore, they will need a variability measure about the median for those...
CK-12 Foundation
Graphs in the Coordinate Plane: Functions on a Cartesian Plane
Connect the dots to graph a linear function. Young mathematicians use an interactive to first plot provided points on a coordinate plane. They connect these points with a line and then answer questions about the slope and y-intercept of...
Curated OER
What's Brewing? Graphing On A Coordinate Plane
In this graphing worksheet, students graph given ordered pairs on a coordinate plane and connect the dots in consecutive order. Upon completion of the graphing exercise, students will have created a picture on the coordinate plane. They...
EngageNY
Sampling Variability
Work it out — find the average time clients spend at a gym. Pupils use a table of random digits to collect a sample of times fitness buffs are working out. The scholars use their random sample to calculate an estimate of the mean of the...


