Curated OER
Designing a Real Life Ecosystem!
Students research abiotic and biotic factors concerning the concept of an ecosystem. Record and analyze data collected. Write a lab report in proper and scientific format with thinking and analytical skills. Work as a cooperative team.
Curated OER
Play on Words Design
Learners create a design of an image that combines two words to create an unusual visualization. They improve their drawing skills by completing a detailed, colored pencil rendering of the "Play on Words" they design. Using technology...
Curated OER
Turn It Upside Down: Introduction to Computer-Aided Design
Students explore a computer-aided design program. Students chart out roller coaster design, computer graphics and architecture. Students focus on understanding the connections between mathematics, science, technology and innovation.
Curated OER
Data Analysis Using Technology
Analyze data using technology. Middle schoolers design data investigations, describe data, and draw their own conclusions. Then they select the best type of graph, graph and interpret the data, and look for patterns in trends. They also...
Curated OER
Monster Data
An inventive lesson shows learners how to collect, organize, and present mathematical data. They access websites which lead them through a variety of ways to engage in data collection. They get to design and create graphs, and present...
Curated OER
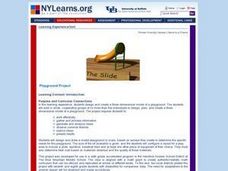
Math: Designing a Playground
Sixth graders design and draw a model playground to scale. They configure the layout to include a sandbox, slide, baseball field and other equipment. Their design includes adaptations for students with disabilities. Their designs are...
Curated OER
Art Criticism: Understanding Wayne Thiebaud's Salads, Sandwiches, and Desserts
Analysis consists of an understanding and interpretation of evidence and elements found in any number of expressive mediums. Upper graders critique the work of American Realist Wayne Thiebaud through a series of excellent guided...
Curated OER
Drive the Data Derby
Three days of race car design and driving through the classroom while guessing probability could be a third graders dream. Learn to record car speed, distances traveled, and statistics by using calculation ranges using the mean, median,...
Teach Engineering
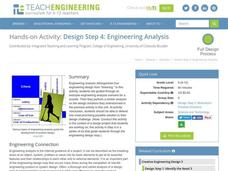
Design Step 4: Engineering Analysis
What is the main difference between an engineer and a technician? This is one of the driving questions in a plan that proves that analysis at every step of development is crucial to the engineering design process. The instructional...
National Sailing Hall of Fame
Sailboat Design Requirements
Sailboat design requires more than a half-circle and triangle sketch. After viewing a slideshow presentation that outlines the requirements for sailboat design, learners draw a design, perform the needed calculations, and write a paper...
Virginia Department of Education
Organizing Topic: Data Analysis
Learners engage in six activities to lead them through the process of conducting a thorough analysis of data. Pupils work with calculating standard deviations and z-scores, finding the area under a normal curve, and sampling techniques....
Code.org
Good and Bad Data Visualizations
Good versus bad data. Pairs rate online collections of data representations from good to bad and then suggest ways to improve the visualizations. The class then creates a list of best practices and common errors in data representations...
Polar Trec
How Much Data is Enough?
The next time you read a magazine or watch the news, make note of how many graphs you see because they are everywhere! Here, scholars collect, enter, and graph data using computers. The graphs are then analyzed to aid in discussion of...
Curated OER
Where is the Science?: Design as an Introduction to the Scientific Method
Students work to create a design that will protect an egg from being dropped from a one story floor. They test their prototype after it is completed. They write clear instructions and link aspects of the design process to the scientific...
Curated OER
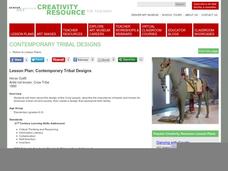
Lesson: Contemporary Tribal Designs
There is a lot to be learned from a horse. Kids analyze a contemporary tribal design found on a large installation piece. Then they create tribal designs of their own that show similarities and difference between cultures and time...
University of Wisconsin
Designing a Rain Garden
Now it's time for all of the data collected in previous lessons to be applied to the design of a rain garden. This resource can only be used as part of the greater whole, since learners will need to rely on gathered knowledge in order to...
National Wildlife Federation
The Tide is High, but I’m Holding On… Using ICESat Data to Investigate Sea Level Rise
Based on the rate of melting observed from 2003-2007 in Greenland, it would take less than 10 minutes to fill the Dallas Cowboys' Stadium. The 17th instructional activity in a series of 21 has scholars use the ICESat data to understand...
Curated OER
Comparison of Univariate and Bivariate Data
Learners explore the concept of univariate and bivariate data. In this univaritate and bivariate data lesson, pupils discuss the differences between univariate and bivariate data. They work sample problems where they must construct box...
Curated OER
Matrix Analysis of Networks
Explore the connection between a finite graph, a directed graph, and a matrix. Graph lines and identify the relationship of matrices in real-world scenarios. Then use this information to work with a partner to plan and design a town...
Curated OER
Wind Effects on Model Building: Pre-Lab for Truss Design and Testing
Emerging engineers perform pre-lab calculations in this first of a three-part lesson on model building. They determine the forces of tension and compression in a truss. After completion of the worksheet, pupils will draw a draft of their...
Science NetLinks
Green Roof Design
Green roofs aren't just eco-friendly — they are literally green with trees. Groups learn about the concept of green roofs in order to be able to design one. The groups design a 5,000-square-foot green roof for a fictional apartment row...
National Gallery of Canada
Designing Balance
Teach your artists how to incorporate balance into their work through discussion and action. After viewing and discussing several works of art, learners design a balanced image for a T-shirt and follow the step-by-step instructions to...
Curated OER
The Final Analysis: Cause and Effect, Fact and Opinion
Middle schoolers read and review informational texts, analyze cause and effect, and distinguish fact from opinion. They assess a "one-minute mystery" you read aloud for cause and effect relationships. Resource includes complete set of...
Curated OER
Literary Analysis: Summary vs. Analysis
What is the difference between summary writing and literary analysis? A 16-slide presentation offers some basic requirements for both types of writing and helps readers identify each based on keywords used in both types of writing....


