Radford University
Danger! – An Analysis of the Death Toll of Natural Disasters
Decipher the danger of natural disasters. Using researched data, scholars work in groups to create data displays on the number of deaths from different types of natural disasters. They share their graphical representations with the class...
Curated OER
Create a Graph Online
Scholars create colorful bar, line, or pie graphs. They decide on a survey question to ask or a type of data to gather. From there, they collect information and data. They display this data in bar, line, or pie graphs that they create...
National Wildlife Federation
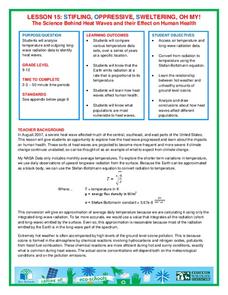
Stifling, Oppressive, Sweltering, Oh My!
Looking for a hot date? Pick any day in August, statistically the hottest month in the United States. The 15th lesson in the series of 21 instructs pupils to investigate the August 2007 heat wave through NASA data, daily temperature...
Curated OER
Ecosystems and Remote Sensing
Students obtain remote sensing data to compare and contrast global biomass data with global temperature data.
Mathematics Assessment Project
Interpreting Distance–Time Graphs
Pre-algebra protégés critique a graph depicting Tom's trip to the bus stop. They work together to match descriptive cards to distance-time graph cards and data table cards, all of which are provided for you so you can make copies for...
Curated OER
Are We Couch Potatoes or Busy Bees? Data Analysis of Physical Activity in School
Students study practical data analysis within the constraints of the scientific method. In this data lesson students collect and enter data into a computer spreadsheet then create graphs.
Curated OER
Handling Data
Students create a simple table in order to solve a problem. As a class, they create a simple data table in order to discover the number of letters in each student's name. This data is interpreted in order to answer questions and make...
Curated OER
Exploring Online Data Analysis Tools Project Interactivate- Plop It
In this data analysis worksheet, students access an online data analysis tool at the given web site. They collect name length data for classmates and enter it into the tool. The find and manipulate the data to determine how the median is...
Beyond Benign
Municipal Waste Generation
Statistically, waste may become a problem in the future if people do not take action. Using their knowledge of statistics and data representation, pupils take a look at the idea of waste generation. The four-part unit has class members...
NASA
A Different Perspective
What can we learn from the data? Young scholars analyze actual solar data to answer specific questions. The activity presents an opportunity for an open-ended investigation of the data to conclude a five-part series on solar winds.
Federal Reserve Bank
“Dewey Defeats Truman”: Be Aware of Data Revisions
Discover the impact and importance of data releases about current economic conditions in the United States. Your class members will learn about data revision and the GDP, and how these figures can alter people's views on the economy.
Curated OER
Tell Us All: Tools for Integrating Math and Engineering
What a scam! Middle and high schoolers pose as journalists exposing consumer fraud. In this lesson, they write an article for a magazine using data collected during previous investigations (prior lessons) to defend their findings that a...
Curated OER
Blue Crabs - The Blue Crab's Chesapeake Journey
A plethora of information about the blue crabs of Chesapeake Bay will amaze and delight your marine biologists. They learn, through direct instruction, about the characteristics and life cycle of this fascinating arthropod. A highlight...
Flipped Math
Unit 5 Review: Bivariate Data
The data says it's a wrap. Pupils work through four review questions with multiple parts dealing with bivariate data. Questions cover creating and interpreting two-way tables and scatter plots with lines of best fit. Scholars finish up...
Howard Hughes Medical Institute
How to Analyze DNA Microarray Data
Unravel the complexities of DNA research. Analyzing DNA data can be a daunting, time-consuming task; however, as the lesson explains, an interactive importance of the research outweighs its complexities. The presentation breaks down the...
US Department of Commerce
How Are Single-Parent Households Distributed Across the United States?
There sure are a lot of single-parent households in the country. After selecting one of four US regions to investigate, pupils create dot plots and box plots on the percentage of single-parent households with male parents and female...
Curated OER
Unit 5: Order Whole Numbers in the 100s and 1,000s
There are three quick number ordering activities here for your mathematicians. First, they analyze data on the number of three types of pies sold. Scholars choose from four ordered lists the one showing fewest to most sold. Then, they...
Curated OER
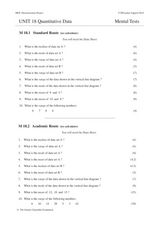
Unit 18 Quantitative Data
In this central tendency activity, students answer 30 short answer questions about data sets. Students find the median, mean, mode, and range of data sets.
Curated OER
Presentation of Quantitative Data- Vertical Line Diagrams
In this quantitative data worksheet, students examine how vertical line diagrams can be used to display discrete quantitative data. They read about the use of tally charts to create vertical line graphs that display the data. They...
Curated OER
Assessing and Investigating Population Data
Students examine population projections. In this population data lesson, students research and collect data on the population of the United States. They explore and conclude future population growth patterns. Students construct tables...
Curated OER
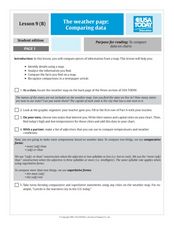
The Weather Page-Comparing Data
Students examine weather patterns in the United States. For this weather lesson, students use a United States map to identify high and low temperatures in two states. Students compare the data and record their findings onto a chart.
Curated OER
Comparing Data on Graph A and Graph B
Second graders gather and graph data. In this graphing lesson, 2nd graders collect data and graph this information using tally charts, bar graphs, pictographs, or tables. They make predictions about the outcomes.
Curated OER
Data Analysis: Infiltration Rate and Composition of Concrete
Students collect and graph data. In this statistics instructional activity, students analyze data using a spreadsheet program. They display their data effectively and analyze it.
Beyond Benign
Medical Ethics
Just because we have the ability to determine an organism's traits through genetic testing, should we do it? Middle-school medical experts examine the ethical dilemmas in biotechnology in the 18th and final installment in a series of...


